
Streaming Telemetry Explained: Push vs. Pull
Nearly every monitoring system ever built works the same way underneath: it asks. Every minute or five, it sends each device a question. How many bytes have crossed this port? Is this interface up? How hot is that power supply? The monitoring system waits for the answer, files it, and asks again. This is polling, the "pull" model of monitoring, and SNMP is its most famous dialect. It has run the world's networks for decades, and it still does.
Streaming telemetry turns the conversation around. Instead of asking over and over, you tell the device once what you want to know and how often you want to hear it. From then on, the device sends the data to you, continuously, without being asked. Monitoring goes from "ask" to "tell": from pull to push. That one reversal sounds small and changes a surprising amount, which is why it gets talked about like a revolution.
This guide explains both models honestly — no eulogy for polling, no hype for streaming. By the end you will understand how each one actually works and what a subscription is. You will know why streaming makes sub-second data affordable. You will see what genuinely improves in daily operations, what does not change at all, and what the new model costs you. No prior telemetry knowledge is assumed.
In this guide
- Pull: how polling actually works
- The wall polling hits at scale
- Push: the streaming model
- Subscriptions in plain words: sample vs. on-change
- Why sub-second data suddenly becomes affordable
- The collector’s new job: drinking from the hose
- What changes: two before-and-after stories
- What does not change
- The honest costs
- The mental model to keep
Pull: how polling actually works
Picture a manager who checks on the team by walking the floor. Every five minutes she stops at each desk, asks "how is it going?", writes the answer in a notebook, and moves on. That is polling. Your monitoring server keeps a list of devices and a schedule. When a device’s turn comes, the server sends a small question over the network. With SNMP, that is a request for specific numbered facts. The device reads the values out of its internal bookkeeping and answers. The server stores the result as one data point with a timestamp. Repeat forever.
Let’s be fair to this model, because it earned its decades. It is simple to reason about: you always know exactly what was asked, when, and of whom. The monitoring server controls the pace, so a small server can watch a big fleet by simply asking less often. And it works on practically everything — the humblest printer and the oldest switch in the closet both know how to answer.
The catch is hiding in plain sight: everything between two answers is invisible. A poll every five minutes produces twelve data points an hour. The other 299 seconds of each interval simply did not happen, as far as your charts are concerned. Anything that starts and finishes inside the gap is either averaged into mush or missed entirely. Think of a traffic spike, a brief outage, an interface that flapped and recovered. Polling does not record your network; it photographs it occasionally and lets you assume the frames in between.
One honest softener before we move on: counters blunt the problem a little. A traffic counter only ever climbs, so the bytes moved during a gap are still included in the next reading. The volume of an unseen burst survives, smeared into an average. What is lost is the shape: when it happened, how sharp it was, whether it saturated anything. And a status that flips down and back up between two polls leaves no trace at all. Keep that distinction; it explains exactly which problems streaming does and does not solve.
The wall polling hits at scale
The obvious fix is to ask more often. Here is why that stops working. Polling cost is multiplication: number of devices, times facts per device, times polls per hour. Every question is a request your server must send and a reply the device must look up, build, and transmit. Run the numbers on a mid-size network:
60 devices x 30 monitored interfaces  =  1,800 interfaces
8 values per interface (status, errors,
traffic counters and friends)         = 14,400 values per sweep

polled every 5 minutes   =     48 questions per second, all day
polled every 30 seconds  =    480 questions per second
polled every 1 second    = 14,400 questions per second
The last line is not a real option, and the middle one is already unkind. The load lands twice: once on your poller, and once — more painfully — on the devices. A switch or router answers management questions with whatever CPU is left over from its real job of forwarding packets. Push the interval down and you eventually meet the polling budget wall: the point where you are rationing questions. You choose which facts to ask for, at which cadence, to keep the machinery polite. Every large SNMP shop lives inside that budget. The tension between "I want finer data" and "I cannot afford to ask that often" is one of the classic signs of outgrowing SNMP for a particular question.
Push: the streaming model
Streaming telemetry attacks the problem by deleting the questions. Collector is the streaming world’s name for the machine that receives and stores the data. In the push model, your collector opens a connection to the device and states, one time, what it wants. That statement is called a subscription, and it names two things. First, which facts to report: specific values like an interface’s traffic counters, named by paths in the device’s data catalog. Second, when to report them: on a timer, or whenever they change.
From that moment on, the device does the talking. Every second, or every change, it sends the subscribed values down the open connection as small timestamped updates. That is a steady ribbon of data instead of a stack of question-and-answer snapshots. The manager stops walking the floor; instead, each employee sends a one-line status at agreed moments, unprompted. Nobody waits to be asked, and nothing depends on the manager remembering to come by.
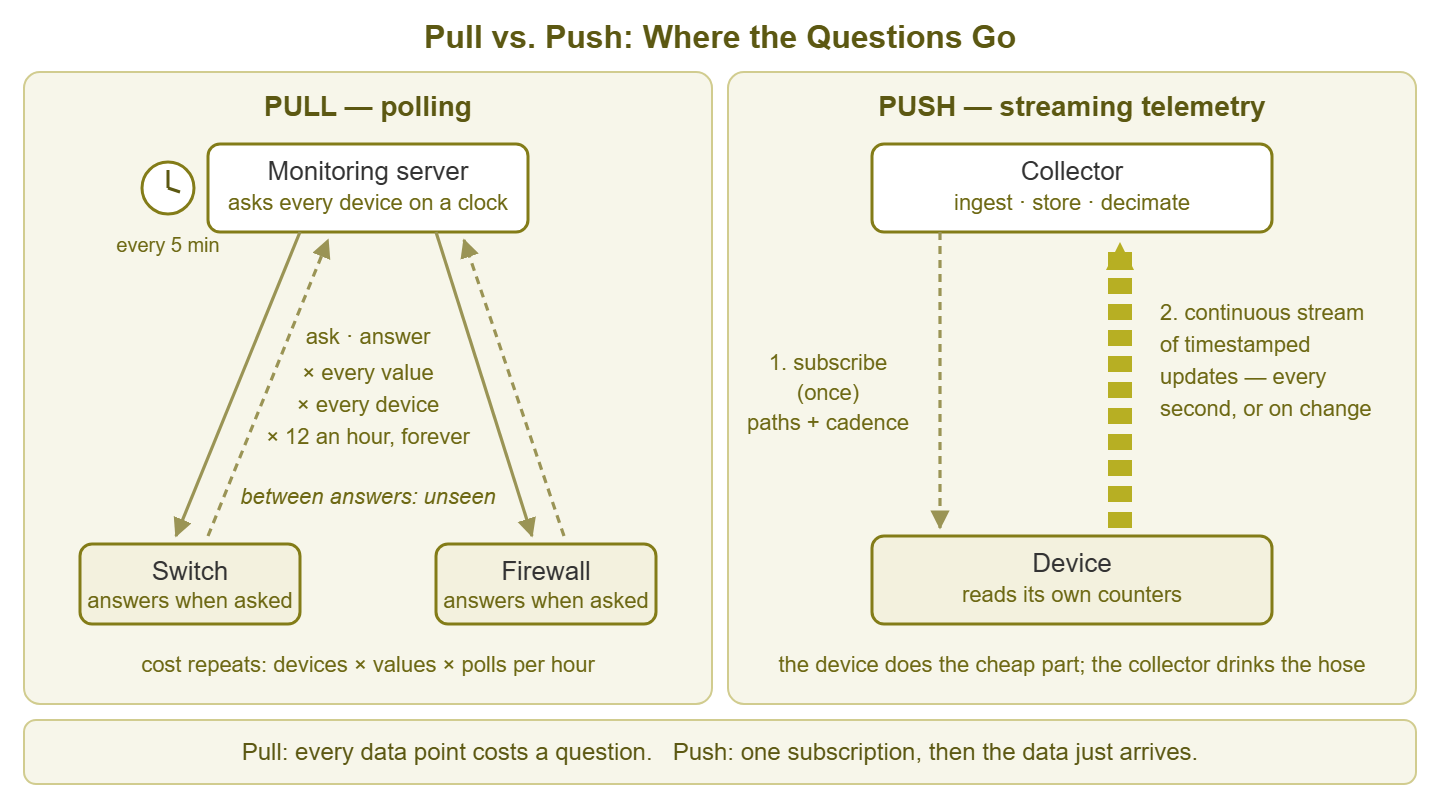
Figure 1: Pull means your server asks every device, every interval, forever. Push means one subscription, then a continuous stream from the device — the questions disappear.
Two details in that picture deserve a highlight. First, the connection is long-lived and reliable. It is typically an encrypted session that stays open, over which updates are acknowledged. That differs from the fire-and-forget datagrams SNMP uses. Second, the device stamps each update with the time it read the value. So your data carries the moment of measurement, not the moment of arrival. (The machinery behind this — gRPC, gNMI, and YANG — has its own plain-words guide: the acronym stack decoded.)
Subscriptions in plain words: sample vs. on-change
Almost every subscription you will ever create is one of two kinds, and choosing between them is the first real skill of streaming telemetry.
A sample-based subscription says: "report this value every N seconds, no matter what." It is the right choice for values that are always changing — above all, counters. An interface’s byte counter climbs with every packet. Asking to be told "when it changes" would mean thousands of updates a second of pure noise. Sampling it on a steady clock — every second, every ten seconds — gives you exactly what charts and rate calculations want. You get evenly spaced readings you can turn into a smooth, honest line.
An on-change subscription says: "tell me only when this value becomes different." It is the right choice for state — things that hold still for weeks and matter enormously when they move. Interface up or down. A routing session established or lost. A fan failed, a power supply degraded. Sampling these on a clock is wasteful ("still up... still up... still up") and adds delay. On-change gives you silence while things are boring and an update within moments when they are not. It is SNMP’s trap idea, reborn on a reliable connection.
The rule of thumb, then: counters get sampled; state gets on-change. Most real deployments run both kinds side by side against the same device — a sampled stream feeding the graphs, an on-change stream feeding the alerts. Some platforms also offer a "let the device decide" mode that picks per value. But the two-kind mental model above is the one to keep.
Why sub-second data suddenly becomes affordable
Here is the quietly clever part. In the polling model, every data point costs a full round trip. Your server builds a request. The device receives it, parses it, checks the credentials, looks up the values, builds a reply, and sends it. Then everyone forgets everything and does it all again next interval. Most of that work is overhead, repeated per question, forever.
In the streaming model, all the expensive parts happen once, at subscription time: one connection, one authentication, one validation of what is being asked for. After that, the device’s recurring job is nearly free. It copies a number it already holds in memory onto an open connection, on a timer it controls, batched efficiently with its neighbors. That is why a device that would buckle under one-second SNMP polling can happily stream the same values every second: the per-reading cost collapsed. Sub-second visibility stops being a stunt and becomes a checkbox. The cost did not vanish, though — it moved. Which brings us to the receiving end.
The collector’s new job: drinking from the hose
Under polling, your monitoring server sets the pace, so it can never be surprised by volume. A collector has no such luck: the devices set the pace now, and the collector’s job is to keep up. That job has three parts. Ingest: receive a continuous stream from every subscribed device and decode it without dropping updates. At one-second cadence, a single busy device can send more data points in an hour than five-minute polling collects from it in weeks. Store: write all of that into a time-series database built for the write rate. And decimate: thin the data as it ages. Keep the one-second detail for days, then average it into coarser points for the months and years. Nobody buys disks for full-resolution eternity.
None of these is exotic, but together they are a real system you must size, run, and watch. The classic beginner surprise is subscribing to everything at one-second cadence "because we can" and discovering what that does to storage in a week. Cadence is a dial, not a virtue: match it to the question, and reserve the fast settings for the links and states that deserve them.
Tip: start any streaming project with a handful of paths on one or two important devices, at a modest cadence like five or ten seconds. You will learn the whole pipeline — subscribe, ingest, store, chart — with data volumes that forgive mistakes. And you can turn the dial up later with real numbers in hand.
What changes: two before-and-after stories
The microburst that polling cannot see
A microburst is a traffic spike measured in seconds or less. Something briefly slams a link to 100%. Buffers overflow, packets drop, and a video call or a storage transaction stumbles. Suppose a three-second burst saturates a 1 Gbps uplink. On a five-minute polling cycle, those three seconds are averaged across three hundred. The burst appears on your chart as a bump of about one percent — indistinguishable from nothing. Users felt a wall; the graph shows a ripple. Now stream the same counters at one-second samples. The chart shows three consecutive readings pinned at line rate, right at the moment the complaints mention. The drop counters rise in sympathy. Nothing about the network changed — only the sampling. The event was always there; polling just could not photograph it.
The flap that arrives before you finish reading the ticket
An interface flap — down, then up again — that lasts twenty seconds between two polls leaves almost no trace in the pull world. Both polls see "up"; at best a counter twitch hints something happened. And the complaint lands as "the network blipped, no, everything looks fine now." Classic SNMP does have an answer — the trap, an unsolicited alarm message. But traps are single unacknowledged packets that can die en route precisely when the network is misbehaving. With an on-change subscription, the story tightens. The down event arrives at your collector within milliseconds over an acknowledged connection, timestamped by the device itself. The up event follows twenty seconds later. Your timeline shows exactly what bounced, when, for how long. Detection latency drops from "sometime this poll cycle, maybe" to "effectively now."
What does not change
Now the part the brochures skip. Streaming changes how data arrives. It changes nothing about what you must do with data. You still need thresholds, and they are still judgment calls. You still need baselines, because "is 400 Mbps normal for this link at 9 AM?" is not a question more decimal places can answer. You still need storage discipline — decimation is the same rollup-and-retention thinking every monitoring pipeline needs, just with bigger numbers. And you still need restraint about alerting, because alert fatigue does not care how fresh the data was. A one-second feed wired to a hair-trigger threshold is simply a machine for generating ignored notifications sixty times faster.
In fact, every lesson from the classic monitoring pipeline applies verbatim to streaming, at higher volume. That includes how readings become stored points, how rollups quietly blur history, and how rendering can hide what storage kept. If you have not yet internalized that pipeline, how telemetry data actually works walks the whole path from device counter to chart pixel, and everything in it transfers. Streaming gives you a sharper camera. Composition, judgment, and knowing what to point it at remain your job.
The honest costs
Three real ones. Device support is the big filter. Streaming telemetry lives on modern routers, switches, and firewalls from the major networking vendors. Broadly, that is the kind of gear with a current operating system and an automation story. The long tail of your fleet — printers, UPSes, older switches, appliances, most of what a small network is actually made of — speaks SNMP and always will. For that gear, streaming is not a choice you get to make.
The tooling is younger. SNMP polling comes ready-made in every monitoring product on earth. Streaming collection more often means assembling pieces — a collector, a time-series database, dashboards — and wiring them together yourself. Entirely doable, well documented, and distinctly more of a project than "add device, enter community string."
The skills are newer. Someone on the team needs to learn subscription paths, certificate-based authentication, and the collector stack. These are learnable, genuinely valuable skills. But they are not yet the common tongue the way SNMP knowledge is. None of these costs is a reason to ignore streaming; all three are reasons to adopt it deliberately. The honest SNMP-versus-streaming comparison weighs every dimension side by side. The readiness checklist helps you find out whether your fleet and your questions justify the effort yet.
The mental model to keep
If you remember one paragraph, make it this one. Polling is a series of interviews conducted on your schedule: you decide the questions and the tempo. The device answers when asked. History is whatever the interviews happened to capture. Streaming is an embedded reporter: briefed once on what matters, filing continuously from inside the device, timestamping events as they happen. It is now your problem to run the newsroom that receives, files, and condenses the copy. Everything else about the two models — the costs, the blind spots, the operational feel — falls out of that one difference.
| Characteristic | Pull (polling) | Push (streaming telemetry) |
|---|---|---|
| Who initiates each data point | Your server, per question, forever | The device, after one subscription |
| Typical cadence | Minutes | Seconds to sub-second, or on change |
| Between data points | Unobserved gap | Continuous stream at chosen cadence |
| Learning of a state change | Next poll, or an unacknowledged trap | On-change update in moments, acknowledged |
| Timestamp reflects | When the poller asked | When the device measured |
| Where the load lands | Poller and device, per request | Device lightly; collector and storage heavily |
| Transport style | Fire-and-forget datagrams | Long-lived encrypted, acknowledged session |
| Device support | Effectively everything | Modern routers and switches, mostly |
| Tooling | Mature, built into every product | Capable, younger, more assembly |
Where to go next
You now have the core distinction the whole subject rests on: ask versus tell, interviews versus a reporter on the inside. The natural next step is meeting the machinery by name: gNMI, gRPC, and YANG decoded. Then comes the practical question of whether any of this is worth adopting on your network. The rest of the Streaming Telemetry guides tackle that head on, comparison tables and readiness checklists included.
Put this into practice with SysPeep Monitor
Whatever streaming telemetry’s place in your future, the fleet you run today mostly answers over SNMP and WMI. Watching that fleet well is exactly what SysPeep Monitor is for. It discovers your devices, collects health and performance data, and alerts you when something genuinely needs a human. The free trial installs on any Windows machine in minutes.
Download Free TrialLearn About SysPeep - All Rights Reserved.