
What Video Calls Need from Your Network (Especially Upstream)
Nobody opens a ticket when a file copy takes an extra minute. Everybody notices when the chief executive's face freezes mid-sentence in front of forty people. Video is the most visible thing your network does and the pickiest: it needs its data now, in order, and at a steady rhythm. Almost nothing else you carry asks for all three at once.
You will usually be handed a circuit spec sheet and told there is plenty of bandwidth. There often is, in one direction. I once spent an afternoon proving a link was fine from its download graph while every call in the building was dying on the upload one. This guide explains what a call actually sends and receives, and why the upload side is where the trouble usually lives. It explains what jitter, loss, and latency do to a call in plain words. It also explains how modern clients quietly lower their own quality long before anything "fails." By the end you will be able to hear "the video was choppy" and know which graph to open first.
In this guide
- What a video call sends and receives
- Why upstream is the usual bottleneck
- Jitter, loss, and latency in plain language
- How adaptive quality hides trouble
- Bandwidth needs by scenario
- The executive-visible failure modes
- What to measure first
- Where to go next
What a video call sends and receives
Start with one person on a laptop in a meeting. Their computer produces several separate streams at once: camera video and microphone audio. When they share their screen, a third stream behaves like a second camera pointed at their desktop. There is usually a small data stream too, for chat and reactions. Each stream is chopped into small packets and pushed up your internet connection many times per second.
Almost every modern conferencing service routes media through its own servers rather than directly between participants. Each participant uploads their own streams once, and the service's media server distributes them to everyone else. So a participant's download side carries one copy of everyone else's audio and the video tiles their client is displaying. It also carries the shared screen if there is one. Their upload side carries only their own contribution.
Two details make the upload heavier than it first looks. First, many clients send more than one size of their camera stream at once — a large version plus one or two smaller ones. That lets the server hand small tiles to people in a crowded gallery view without re-encoding anything. Second, screen sharing is usually sent at high resolution so text stays readable. When the shared content moves (a video clip, a scrolling spreadsheet, a fast product demo), it can briefly cost more than the camera does. Audio, by comparison, is tiny and steady, which is why it is the last thing to break.
The mental model to keep
Every participant is both a broadcaster and a viewer. A laptop in a twelve-person meeting downloads a mixed audio feed plus however many video tiles it is showing. It uploads its own camera, microphone, and share. Now multiply that across everyone in the office on a call at the same moment, and the shape of the problem appears.
Why upstream is the usual bottleneck
Most business internet connections are asymmetric: much more capacity for downloading than for uploading. That suits browsing, streaming, and updates, where an office receives far more than it sends. Video turns it on its head. Every participant in your building uploads their own camera, at the same time, through the same narrow pipe.
Picture a normal morning: fifteen people in the office join four different meetings. Downloading is comfortable — each person pulls a few tiles down the wide side of the circuit. But fifteen camera streams, plus a couple of screen shares, plus the big camera in the boardroom, are all pushed up the narrow side at once. The upload direction fills. When it is full, packets either wait in a queue (adding delay and jitter) or are thrown away (loss). Everyone on a call feels it at the same moment, and not one of your download graphs shows anything wrong.
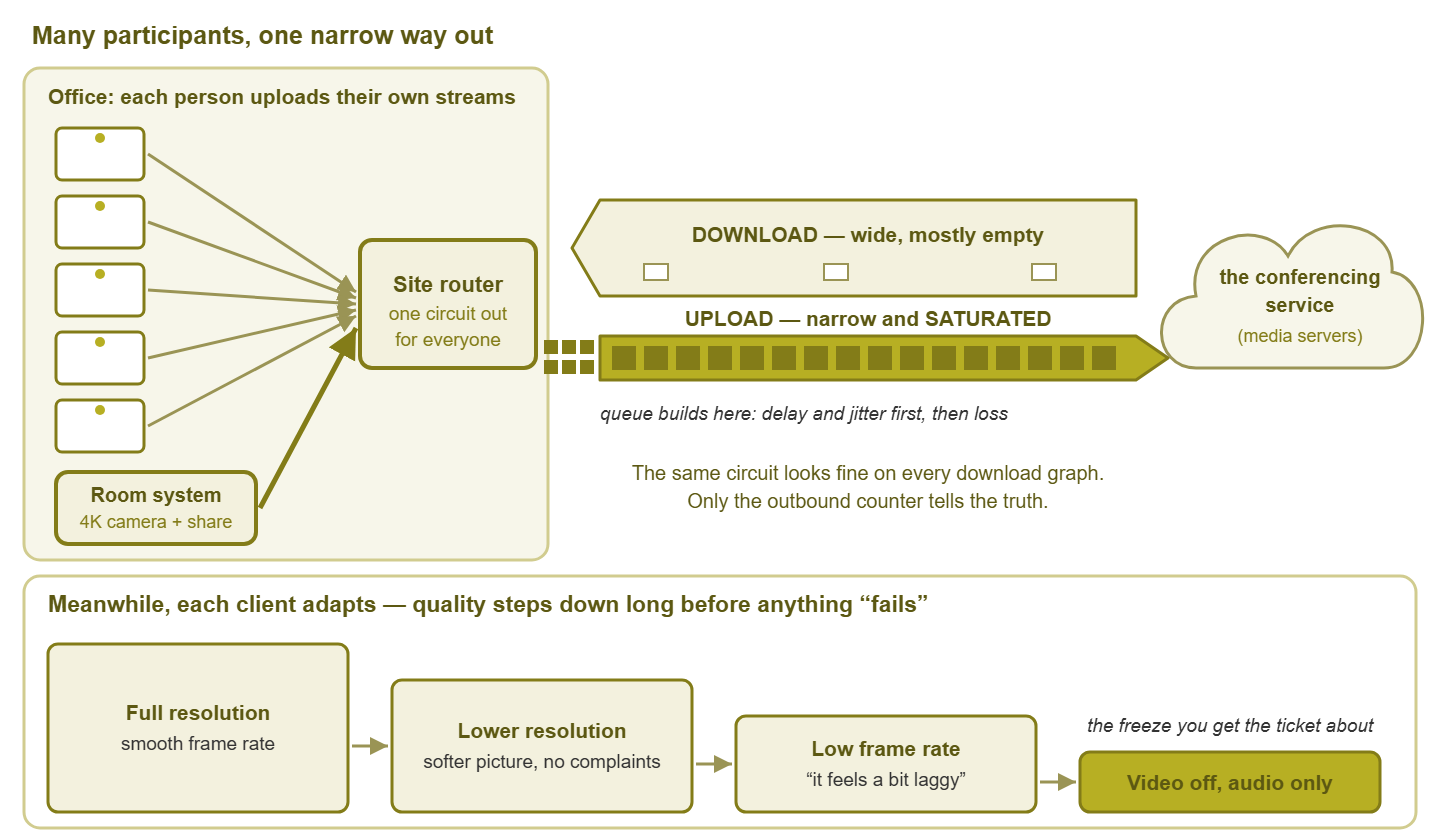
Figure 1: Everyone uploads their own video through the narrow side of the circuit. When it fills, clients quietly step their quality down — and the last step is the freeze you get the ticket about.
The upload side is also shared with things nobody thinks of as "video." Cloud backup agents and file-sync clients pushing a folder of photos travel the same narrow lane. So do an email with a large attachment, security cameras streaming to a cloud recorder, and someone uploading a promotional video. A single workstation backup can own the entire upstream for ten minutes. The same problem appears inside the building on switch uplinks, a story of its own in Uplink Saturation.
The fix is not always "buy a bigger circuit," though sometimes it is. The first fix is to see it: graph the upload direction of your internet interface separately from the download direction. Use a resolution fine enough to catch a five-minute spike. And put a threshold on it. Many "video is bad" tickets close the moment someone looks at the outbound counter instead of the inbound one.
At Meridian Parts the Tuesday ten o'clock board call froze at ten past, every week, for two months. The circuit was upgraded once and the room system replaced once (the new one was very handsome), and the freeze survived both. Someone finally graphed the upload direction on its own and found a workstation backup agent that started at 10:05. It owned the upstream for a quarter of an hour. It had been installed on the finance manager's machine in the spring and scheduled for "a quiet time." The backup now runs at seven in the evening, and the board call has not frozen since.
Jitter, loss, and latency in plain language
Three words describe almost everything that goes wrong with a call in transit. Latency is how long a packet takes to travel from sender to receiver: the delay. Jitter is how much that delay varies from one packet to the next: the wobble. Packet loss is the share of packets that never arrive at all. A postal analogy holds up well. Latency is how many days a letter takes. Jitter is whether it is two days one week and five the next. Loss is the letters that simply vanish.
Real-time media cannot wait for a missing piece to be sent again. By the time the resend arrived, the moment it belonged to would be over. Voice calls are fragile for the same reason, as VoIP Monitoring Basics explains. So the receiver plays what it has. A lost audio packet becomes a tiny gap, patched over with a guess. A lost video packet is worse than it sounds. Video is sent as an occasional complete picture with many small "here is what changed" updates in between. Losing a single packet can smear or freeze part of the picture until the next complete picture arrives.
Jitter is absorbed by a jitter buffer: the receiver holds packets for a short time so it can play them out at an even rhythm. A bigger buffer smooths more wobble but adds delay, so the client is forever compromising between smoothness and lag. Latency itself, once it grows large, does something no buffer can fix: people start talking over each other. The pause they hear is the network, not the other person thinking. Two people apologising to each other at once is latency's signature.
You can see all three with the humblest tool you own. Here is a ping to a nearby test address during a busy minute:
Reply from 203.0.113.10: bytes=32 time=21ms TTL=54
Reply from 203.0.113.10: bytes=32 time=19ms TTL=54
Reply from 203.0.113.10: bytes=32 time=88ms TTL=54
Request timed out.
Reply from 203.0.113.10: bytes=32 time=143ms TTL=54
Reply from 203.0.113.10: bytes=32 time=22ms TTL=54
The twenty-ish milliseconds is the latency. The jump to eighty-eight and then one hundred forty-three is jitter — the wobble a buffer has to hide. The timeout is loss. A call running across this link at that moment would have hiccuped right there. The person on it would have described it as "it glitched for a second."
Why video breaks differently than voice
Video packets are bigger and far more numerous than audio packets, so on a saturated link they are proportionally more likely to be delayed or dropped. But video has a trick audio lacks: it can shrink, and the shrinking is the most misleading thing a modern call does.
How adaptive quality hides trouble
Conferencing clients constantly measure the network and adapt. When they detect rising loss or jitter, they lower the resolution and reduce the frame rate. They also cut the bitrate (the amount of data sent per second). They do all this silently. The participant sees a slightly softer picture and nobody complains. If conditions get worse, the client drops video entirely and protects audio. A meeting with audio and no video is still a meeting, while the reverse is a mime act.
This is excellent engineering and terrible for monitoring, because the call degrades long before anything fails. By the time you get a ticket, the client has probably been stepping down for minutes, and the freeze is only the last step. Four consequences follow:
- Do not wait for failures. The interesting signal is the quality level a client is sending — resolution and frame rate over time — not whether the call is up or down.
- Audio surviving while video dies is a fingerprint. It says "bandwidth or loss pressure," not "the video software is broken." The client did exactly what it was designed to do.
- The service's per-call statistics are evidence. Most conferencing services let an administrator see, per participant, the sent and received resolution, bitrate, loss, and jitter over the life of a call. A resolution that stepped down at 10:14 is a timestamp you can hold up against your own graphs.
- You still need your own measurements. The service can tell you that a participant's connection degraded. Only your monitoring can tell you why — which link filled, which access point was struggling, which backup kicked off.
Tip: when a user says "the audio was fine but the video froze," you are almost certainly looking at bandwidth or loss on their upload path. The client protected the audio on purpose. When the audio was robotic as well, the link was in real trouble — or the device itself was overloaded and could not encode in time. Those are two different investigations, so ask the question early.
Bandwidth needs by scenario
There are deliberately no numbers in this section. Each service publishes its own requirements, clients adapt to whatever they find, and the figures shift with each new feature. What does not change is the shape of the demand, and the shape is what tells you where to look.
| Scenario | What goes up from the office | What comes down | What to watch |
|---|---|---|---|
| One-on-one call | One camera plus audio | One camera plus audio | Usually comfortable unless the link is busy with something else |
| Small gallery (a handful of tiles) | The same one camera, possibly in several sizes | Several tiles | Download grows with the tile count; upload barely changes |
| Large gallery or all-hands | The same one camera | Many small tiles or an active-speaker view | Download, though the service usually caps what it sends to each viewer |
| Screen share, static slides | Camera plus a bursty share that spikes when the slide changes | Unchanged | Short upload bursts; harmless unless the link is already near full |
| Screen share with motion (video, demo) | Camera plus a heavy, sustained share | Unchanged | The heaviest common case for one laptop; watch the presenter's upload path |
| Room system with a 4K camera | A high-resolution camera stream plus room audio, and the share when presenting | Remote tiles for the display | Often the single largest upstream contributor in the building |
| Many people in one office | One camera per person, all through one circuit | One gallery per person | The sum of the upstream contributions at the busiest hour |
Read the last row twice, because it is the whole point. You do not need exact figures to know whether your upstream is comfortable or tight. Add up everyone who is on a call at the busiest hour. Remember that each of them uploads their own camera. Then look at the outbound utilization graph of your internet interface for that hour. If it is brushing the ceiling, you have your answer. What to do about the busiest hour is the subject of Giving Video the Road It Needs.
The hybrid meeting twist
A hybrid meeting is a room full of people plus colleagues at home. It is easier on your circuit than it looks, provided the room joins once through the room system. Suppose six people in the room also open the meeting on their laptops "to see the chat." You now have six extra cameras and six extra downloads on the same access point and the same uplink. The room now competes with itself. That single habit causes more boardroom freezes than any spec sheet ever will.
The executive-visible failure modes
Users describe symptoms, not causes, and the same words can point at very different problems. This table translates the complaints you will hear into what was probably happening and where to look first.
| What they saw or heard | What was probably happening | Likely causes | First thing to check |
|---|---|---|---|
| Their own video froze for everyone else | Their upload path lost or delayed packets | Saturated upstream, Wi-Fi retries, a full-tunnel VPN, a busy laptop | Outbound utilization on the circuit; the access point they were on |
| Everyone else froze for them | Their download path or the service struggled | Download saturation (rare), the service's media edge, their device | Inbound utilization; the service's per-call statistics |
| Robotic or "underwater" audio | Audio packets lost, or the jitter buffer overwhelmed | Congestion, Wi-Fi interference, device CPU starvation | Loss and jitter toward the service; the device's CPU at that minute |
| Echo | Sound from a speaker being picked up by a microphone | Two devices open in one room; a room whose echo cancellation is off; a far-end laptop without a headset | Who had two devices joined; the room's audio settings — this one is almost never the network |
| Call dropped or "reconnecting" | All media or the control connection was lost for seconds | Link flap, NAT session timeout, a Wi-Fi roam, a VPN reconnect | Link status logs, access point roaming events, firewall session timers |
| Blurry, blocky, or smeared video | Adaptive step-down, or a lost packet damaging the picture until the next full frame | Bandwidth pressure at either end | Sent and received resolution in the service's statistics |
| Lips out of sync with voice | Audio and video buffered by different amounts | Heavy jitter; an overloaded sending device | Jitter toward the service; the sender's CPU |
| "Your connection is unstable" banner | The client's own loss or jitter threshold was crossed | Any of the above | Match the timestamp against your interface and Wi-Fi graphs |
Notice how often the first check is a graph of your equipment at a specific minute. Most of these cannot be diagnosed after the fact unless something was recording the network during the call. That is the strongest argument for setting up the next section before anyone important has a bad meeting. The full investigation, when the ticket arrives, is in Diagnosing the Executive's Frozen Call.
What to measure first
You do not need a video-specific monitoring product to get most of the value. You need a few ordinary measurements, kept continuously, at a fine enough grain to catch a bad minute. Set them up in this order.
- 1. Outbound and inbound utilization on the internet interface, separately. Poll the circuit-facing interface over SNMP and graph the two directions as two lines, not one. Alert when outbound sits near the ceiling for more than a couple of minutes. This single graph answers more video questions than everything else combined.
- 2. Loss, jitter, and round-trip time toward the service. A continuous synthetic probe from each site to the service's nearest edge gives you a timeline of the path's health. It lines up with call complaints. The details of doing this well are in Monitoring Reachability to Conferencing Services.
- 3. Wi-Fi experience for the people who matter. Watch client counts, retry rates, and signal quality on the access points serving the boardroom and the corner offices. Wi-Fi Experience Metrics explains which of those numbers actually predict a bad call.
- 4. Room systems as first-class devices. Reachability and registration of every room device, and a scheduled test call that proves the room can join, as described in Meeting Rooms That Always Work.
- 5. The service's own per-call statistics. Not something you poll, but something you know how to find quickly, so that a complaint's timestamp becomes a resolution graph within a minute of asking.
A word on polling interval. Video trouble lives in minutes, not hours. An interface graph averaged over fifteen minutes smooths a three-minute saturation into a harmless-looking bump. You will "prove" the network was fine when it was not. Poll the interfaces that matter to video at one-minute intervals, or as close as your equipment tolerates. Keep enough history to look back at last Tuesday's board meeting.
Tip: keep a short written list of "things that upload": backup agents and their schedules, file-sync clients, cloud-connected cameras, and any server that replicates off-site. When outbound utilization spikes during business hours, that list turns a hunt into a lookup. Most of the entries can be rescheduled to the evening in one afternoon of configuration.
Where to go next
You now know the shape of a video call. There are several streams per participant, with everyone uploading at once through the narrow side of the circuit. The receiver cannot ask for a lost packet again. The client hides the damage by stepping quality down until the last step is a frozen face. Put the outbound graph, a probe toward the service, and the Wi-Fi and room measurements in place. Then "the video was bad" becomes a minute, a link, and a cause. The graph to open first is the outbound one. It always was. The rest of Video Conferencing Performance builds on that foundation. It covers keeping meeting rooms reliable and running the frozen-call investigation. It also covers watching the path to the service and giving video the road it needs at the busiest hour.
Put this into practice with SysPeep Monitor
The graphs this guide keeps pointing at are ordinary monitoring done consistently. They cover outbound utilization on the internet link, switch uplinks, access point health, and room devices going quiet. SysPeep Monitor discovers your devices and interfaces and polls them over SNMP and WMI. It puts upload and download on live dashboards with thresholds that stay quiet until the narrow side of your circuit fills. The free trial installs on one Windows machine.
Download Free TrialLearn About SysPeep - All Rights Reserved.