
RF Interference and Channel Utilization in Plain Language
Here is a complaint pattern that breaks people's brains: the Wi-Fi in one corner of the building is slow every afternoon. The access point there is up. Its CPU is bored. Your throughput graphs show hardly any traffic. Every device-level number says "healthy," and yet users in that corner are watching progress bars crawl. The explanation is not in any device. It is in the air between them. The air does not appear on a device dashboard unless you ask for it by name.
Radio frequency (RF) problems have a scary reputation because they are invisible and physics-flavored. But the core ideas fit in one metaphor a child could use. The two measurements that matter — channel utilization and noise floor — are numbers most access points will happily report if asked. No spectrum analyzer required, no antenna theory, no math beyond percentages.
By the end of this guide you will be able to explain why a channel can be full when your network is idle. You will recognize the signatures of the usual non-Wi-Fi troublemakers (the microwave oven remains undefeated). You will be able to monitor the two numbers that reveal all of this. And you will be able to make the classic judgment call: change channels, add access points, or shrug and eat lunch elsewhere.
In this guide
- Airtime: one shared road
- Channel utilization is not your throughput
- Co-channel vs adjacent-channel overlap
- The non-Wi-Fi troublemakers
- Monitoring utilization and noise, per radio
- Channel planning for small organizations
- Re-channel, add APs, or shrug?
- Where to go next
Airtime: one shared road
Everything in this guide follows from one fact: a Wi-Fi channel is a single shared road, and only one vehicle can be on it at a time. In a given area, on a given channel, exactly one radio can usefully transmit at any instant — one AP or one client, yours or your neighbor's. Everyone else waits. Wi-Fi is polite by design: before transmitting, a radio listens, and if someone else is talking, it holds its thought and tries again in a moment. The technical name for this listen-before-talk politeness is carrier sensing, but "waiting for a gap in the conversation" is the whole idea.
The time on that shared road is called airtime, and airtime — not bandwidth, not signal bars — is the scarce resource in wireless. Every transmission consumes some. That includes your file transfers and your neighbor's video streams. It includes the little management announcements every AP broadcasts many times per second, and every retransmission of a frame that arrived garbled. Slow talkers are the hidden tax. A device with a weak signal falls back to slower data rates. That means it occupies the road longer to say the same thing. One faraway laptop can consume more airtime than five nearby ones. When the road is full, everyone's traffic waits, and waiting is what users call "slow."
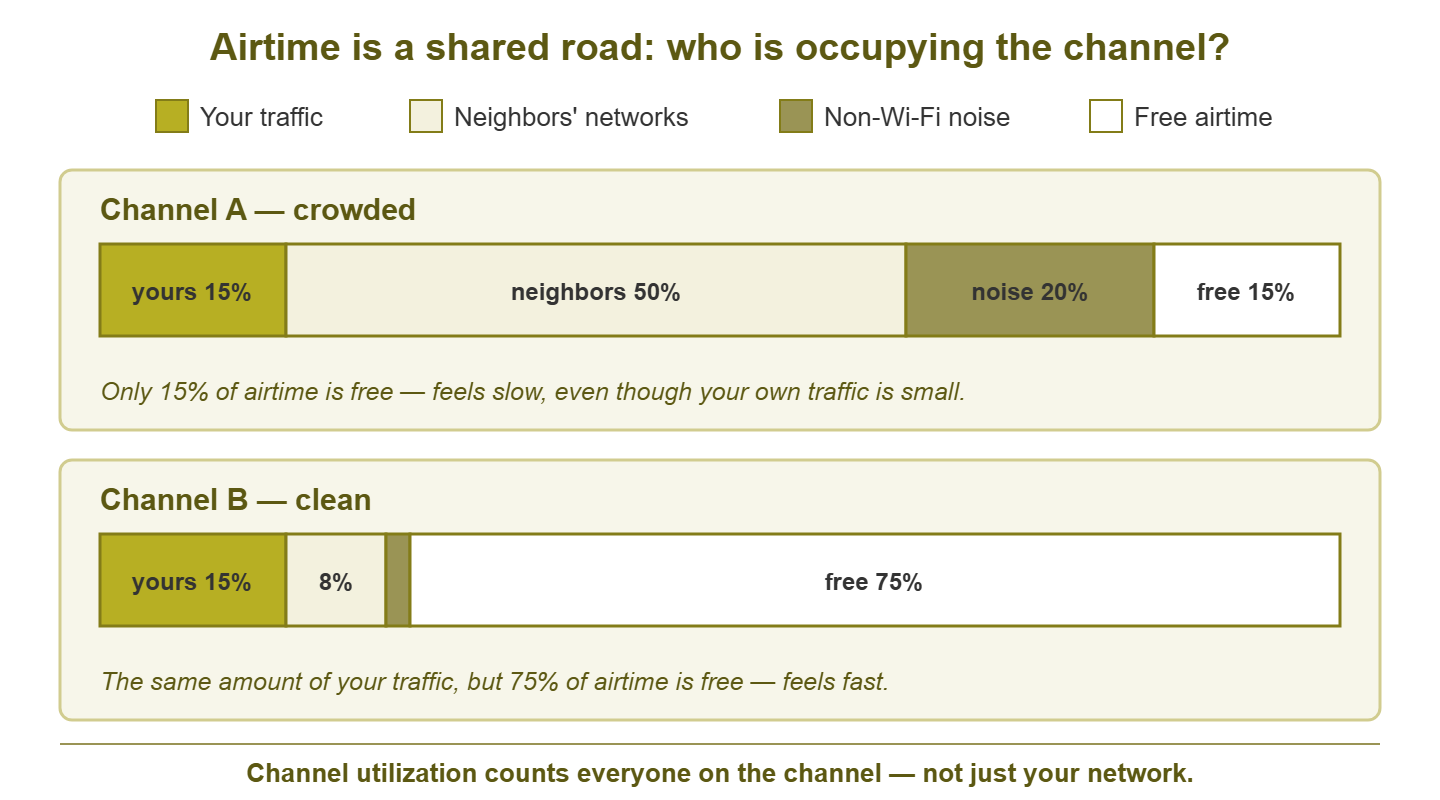
Figure 1: Airtime on two channels. Channel A feels slow even though "your" traffic is small — the road is full of other people's traffic and noise. Channel B has room to talk.
Channel utilization is not your throughput
Channel utilization is the percentage of time the channel is occupied by anything the radio can hear. Read that definition twice, because the word "anything" is where admins get burned. Utilization counts your traffic, other networks' traffic on the same channel, management chatter from every AP in earshot, retransmissions, and time blotted out by non-Wi-Fi noise. Your throughput graph, by contrast, counts only the bytes your own equipment moved.
So the haunted-corner mystery from the intro dissolves. The channel there can be busy to the brim with the traffic of the business next door, while your throughput graph — which only knows your bytes — flatlines near zero. The road is jammed; it just is not jammed with your cars. Users experience the jam. Your graphs describe your cars. Both are telling the truth, and only channel utilization tells you the truth that matters.
This is why utilization, reported per radio by the AP itself, is the single most valuable RF number you can collect. Here is rough furniture for your judgment. Below about thirty percent, the channel feels open. Around fifty, interactive things start to feel sticky. Beyond about eighty, users describe the network as broken regardless of what any other metric says. Those are rules of thumb, not physics, but they will not embarrass you.
Co-channel vs adjacent-channel overlap
Two networks can get in each other's way in two different ways. It is worth being able to tell them apart, because one is merely slow and the other is actively destructive.
Co-channel overlap: sharing the meeting. When your AP and a neighbor's AP sit on the same channel, their radios can hear and understand each other. So they join the same polite turn-taking. Think of it as two teams forced to share one meeting room. It is orderly: everyone waits for the floor, and everything takes longer because the talking time is split. Co-channel overlap wastes airtime but preserves order — performance degrades smoothly as the channel fills.
Adjacent-channel overlap: shouting through the wall. Channels are really bands of spectrum, and channels that are close in number overlap each other partially. Two networks on overlapping-but-different channels cannot understand each other's transmissions — they cannot join the same turn-taking. So each just hears the other as bursts of garbage that corrupt frames mid-flight. Corrupted frames mean retries, retries consume more airtime, and the two networks poison each other without either being able to coordinate. Two meetings held in one room, both shouting. The counterintuitive rule that falls out of this: sharing a channel exactly is better than partially overlapping one. If you must coexist with a neighbor, coexist on the same number.
One uncomfortable note before blaming the neighbors: the most common source of co-channel overlap is your own fleet. Two of your APs on the same channel within earshot of each other split one road between them. Every client of both shares a single turn-taking queue, and adding the second AP bought you coverage but not capacity. This is why "just add another AP" sometimes makes a slow area slower: without a channel plan, you built a second meeting in the same room. Check your own channel assignments before drafting the strongly worded note to the office next door.
The non-Wi-Fi troublemakers
Wi-Fi lives in unlicensed spectrum, which is a polite way of saying it lives in a shared apartment with some noisy roommates. Plenty of ordinary hardware emits energy in the same frequencies — especially in the older, lower band (the one around 2.4 GHz). That band penetrates walls well and is therefore where both your long-range coverage and everyone's junk electronics congregate. The higher bands (5 GHz and up) have far more room and far fewer non-Wi-Fi tenants. Each troublemaker has a recognizable signature — a pattern in time and effect that you can often identify from monitoring data alone:
| Interferer | Where it hits | Signature | What users feel |
|---|---|---|---|
| Microwave oven | Lower band, wide swath | Daily spikes at meal times, minutes long, strongest near the kitchen | "Wi-Fi dies every lunchtime" |
| Cordless phones and headsets | Lower band, sometimes higher | Intermittent bursts that follow a person or desk | Slowness that wanders and defies reproduction |
| Wireless cameras / video senders | One spot, continuously | Constant utilization or noise on one channel, day and night | One area permanently mediocre |
| Bluetooth gadgets | Lower band, hopping around | Diffuse, mild, everywhere; rarely dominant | Usually nothing; a faint background tax |
| Baby monitors, motion sensors, misc. senders | Lower band, fixed | Constant narrow interference near one location | A stubborn slow zone with no Wi-Fi cause in sight |
| Failing electronics, some lighting | Broad, indiscriminate | Raised noise floor whenever powered on | General degradation tracking one device's power switch |
The microwave deserves its legend. It cooks by pumping energy into the same band your long-range Wi-Fi uses. A tired door seal lets enough leak to flatten nearby communication for the duration of every burrito. If your monitoring shows utilization or noise spiking on the lower band every day across the noon hour, near the break room, you have not found a network problem — you have found lunch.
Monitoring utilization and noise, per radio
You do not need special hardware to watch any of this, because every AP already contains the perfect sensor: its own radio. Two numbers, collected per radio every few minutes, cover most of the ground.
Channel utilization per radio is the headline. Collect it from the AP or controller over SNMP or whatever management interface your fleet exposes. For the plumbing, see the AP fleet guide. Graph it per radio, and pay attention to the shape over time, not single readings. Utilization that tracks your office's occupancy is load. Utilization that stays high at 2 AM when the building is empty is somebody else's network or a non-Wi-Fi transmitter. Utilization that spikes on a clockwork schedule is an appliance with a schedule — see: lunch.
Noise floor per radio is the background hiss: the energy level the radio hears when nobody is validly transmitting. It is reported in dBm (a logarithmic power unit, negative numbers, closer to zero meaning louder) and a healthy quiet channel usually sits somewhere in the −90s. What matters is change. A noise floor that steps up by ten or more dB and stays there means something started shouting. Because signal quality is really the gap between signal and noise, a louder floor degrades every client on the radio at once, even the close ones. Rising noise with flat utilization is the classic fingerprint of a non-Wi-Fi interferer: the radio cannot decode the racket as Wi-Fi, but it hears it just fine.
Corroborate with the retry rate: when utilization or noise climbs, retries climb with it, because more frames arrive damaged and must be resent. Retries are also the bridge to what users feel. They are the mechanism by which a dirty channel becomes the packet loss and jitter that ruin calls. That chain is traced end-to-end in the Wi-Fi packet loss guide. Some APs go further and offer a spectrum view that classifies interferers by name ("microwave," "video sender"). Where you have that, enjoy it, but treat it as a labeling convenience. The utilization, noise, and retry trends already tell you whether there is a problem and when it happens.
One visibility caveat: a radio natively reports the channel it is on. Many APs also scan other channels in the background — briefly hopping off to listen. Fleets with a coordinating brain often pool those scans into an air-quality view per area. Where you have that, you can compare candidate channels without leaving your desk. Where you do not, a laptop walked to the problem area with any Wi-Fi scanning tool fills the gap for the price of a stroll.
Here is how the pieces combine on a real ticket. Complaint: "Wi-Fi in the east wing crawls every afternoon." Pull the east-wing radios' utilization history. The lower-band radio climbs past eighty percent from about 1 PM, while your own throughput through that AP barely moves. So it is not your load. Noise floor: flat, so it is a network, not an appliance. Retry rate: elevated in step with utilization, confirming clients feel it. Background scan: the same-channel neighbor is a strong transmitter from the building next door, and an alternative clean channel exists. Diagnosis in four graphs, fix is a re-channel, total effort twenty minutes — and every step was data you were already collecting.
Tip: baseline before you judge. Collect utilization and noise per radio for two normal weeks before deciding anything is "high." Offices have rhythms — the Monday all-hands, the lunchtime surge, the neighbor's evening backup job. A threshold set without knowing the rhythm will either cry wolf daily or sleep through everything.
Channel planning for small organizations
Since the problem is overlap, the fix is arrangement: place your APs' channels so they overlap as little as possible with each other and with the neighbors. This is channel planning, and for a small organization it reduces to a few principles rather than a science project.
- Use only non-overlapping channels. In the crowded lower band, the channel numbers are spaced so that most of them partially overlap. Only a few — famously channels 1, 6, and 11 in most regions — fit side by side without touching. Use those and only those. Picking channel 4 to be "between the crowds" is the shouting-through-the-wall scenario from earlier; it makes things worse for everyone, you included.
- Alternate channels like a checkerboard. Neighboring APs should never share a channel. With three clean channels you can tile a floor so no two adjacent cells match. Sketch it on the floor plan; the pattern falls out in minutes. Upstairs and downstairs count as neighbors too: floors are see-through to radio.
- Prefer the higher bands for capacity. The band around 5 GHz (and above, where available) offers many non-overlapping channels, carries most modern devices, and contains dramatically less junk. Its shorter reach is a feature for reuse: cells that end sooner collide less.
- Be modest with channel width. Radios can bond channels into wider ones for speed — taking two lanes at once. Wider channels mean fewer distinct ones, which means more overlap between your own APs. In anything but a sparse deployment, narrower-and-cleaner beats wider-and-contended.
- Let auto-channel run, but audit it. Most fleets can pick channels automatically, and most of the time that beats a stale manual plan. Trust it the way you trust a new intern: review its choices occasionally, especially after complaints. If it re-shuffles channels frequently, that thrashing is itself a signal that the air is contested.
Re-channel, add APs, or shrug?
Eventually monitoring shows you a dirty channel, and you face the classic three-way decision. A short walkthrough of each exit, with the evidence that points to it:
Re-channel when the problem is this channel, not this place. The pattern is high utilization mostly from networks that are not yours, or a non-Wi-Fi interferer parked on one channel. Your monitoring must also show that other channels in the same area are quiet. Moving is cheap and fast; the radio changes channels, the clients follow within moments. Example: the east-wing radio lives at eighty percent utilization while your own traffic is a sliver. A scan shows the co-located gym's network camping the same channel. The alternative channel is at fifteen percent. Move. Done before coffee cools.
Add or move APs when the problem is genuine demand: utilization high and it is your traffic, retries rising with occupancy, weak client signals at the edges of the area. No channel is empty of your own users' load — the road itself is too small. More radios on more (non-overlapping) channels means more parallel roads and shorter distances, which also raises everyone's data rates and shrinks each transmission's airtime cost. Placement is its own craft — the dead-zones guide covers surveying and validating. Remember that packing APs tighter usually means turning their power down. That has pleasant side effects on client roaming, explained in the roaming guide.
Shrug when the interference is brief, periodic, external, and tolerable: the microwave's noon spike, the weekly event next door. Not every anomaly deserves an engineering response. Document it with a note on the dashboard saying "lunchtime dip near the break room is the microwave; known, accepted." That way, the next admin does not burn an afternoon rediscovering it. A labeled shrug is a legitimate operational outcome; an unlabeled mystery is not.
| Evidence pattern | Likely story | Sensible move |
|---|---|---|
| High utilization, little of it yours; another channel is clean | Neighbors or an interferer own this channel | Re-channel |
| High utilization, mostly yours; weak signals at area edges | Real demand outgrew the design | Add or reposition APs |
| Noise floor up, utilization flat, on a schedule | Non-Wi-Fi appliance nearby | Find it, replace it, or shrug with documentation |
| All channels busy everywhere, all day | Dense environment; airtime is simply scarce | Higher bands, smaller cells, modest widths — and patience |
Where to go next
You now hold the mental model that demystifies most "slow Wi-Fi" tickets. Airtime is one shared road. Utilization measures the whole road, not just your cars. Exact sharing beats partial overlap. The junk drawer of modern life emits radio. And two per-radio numbers — utilization and noise floor — surface all of it. Wire those numbers into your fleet collection with the AP health guide. Connect them to what users report through the experience metrics guide. Find the rest of the series at Wi-Fi Monitoring: What Users Actually Experience.
Put this into practice with SysPeep Monitor
Channel utilization and noise trends only help if something is collecting them around the clock. SysPeep Monitor gathers per-radio and per-port metrics from your APs and switches over SNMP. It graphs them against their own history and alerts when a radio steps outside its normal. So the lunchtime microwave becomes a labeled pattern instead of a weekly mystery. The free trial installs on any Windows machine.
Download Free TrialLearn About SysPeep - All Rights Reserved.