
Anatomy of an Alert Storm
It is 9:14 on an ordinary Tuesday when your phone starts buzzing. Not once — continuously. By 9:20 you have forty-seven alert emails: switches unreachable, servers down, printers offline, a file share failing its check, two access points gone. Every single alert is accurate. And somewhere underneath the pile there is exactly one actual problem.
This is an alert storm, and the first thing to understand about it is that nothing malfunctioned. Your monitoring system did precisely what you configured it to do: it checked everything, and everything behind one failed device honestly failed its check. A storm is monitoring doing exactly what it was told — at the worst possible moment. That reframe matters, because the cure is not "less monitoring." The cure is learning to read the storm, and then teaching your tools to read it for you.
This guide is about the reading part — the first and most transferable skill in alert correlation. By the end you will know how storms form and the three shapes they take. You will know how to scan a raging pager like a map instead of a queue, and what your first five moves should be. You will also know how every storm you survive makes the next one smaller.
In this guide
- Why one failure becomes fifty alerts
- The three kinds of storms
- The timing signature: burst vs. bad luck
- Reading a storm's shape
- First moves when the pager melts down
- Making the next storm smaller
- A worked storm: the 47-alert Tuesday
- The storm-reading checklist
Why one failure becomes fifty alerts
A monitoring system is a machine that asks thousands of narrow questions on a schedule. The questions are: is this device answering pings, is this port up, does this name resolve, is this service running. Each check is deliberately simple, and each check is independent — it knows its own answer and nothing else. That independence is what makes checks reliable, and it is also exactly what makes storms possible.
Because networks are built out of dependencies. A dependency is simply a "needs" relationship. The devices in a wiring closet need their closet switch. The closet switch needs the core switch. The branch office needs the WAN link. Nearly everything needs DNS and power. When one shared thing fails, everything that depends on it stops working too — or at least stops being reachable. In that case, every independent check dutifully reports its own little disaster. Fifty honest answers to fifty narrow questions, all describing the same event from fifty angles.
The size of a storm tells you something immediately: it is proportional to how central the failed thing is. A dead desktop makes one alert. A dead access switch makes a dozen. A dead core switch, DNS server, or storage array makes a screen you have to scroll. Experienced admins invert that logic on instinct — a huge storm means a shared, central failure. That actually narrows the suspect list to a handful of devices. The skill of turning fifty alerts back into one story is called correlation. While tools can do part of it (we will get there), the human version comes first. That is because you will be doing it at 9:14 on a Tuesday whether you have fancy tooling or not.
The three kinds of storms
Storms are not all alike, and the differences are useful: each kind has a recognizable pattern, and the pattern points at a different class of culprit.
Reachability storms: the path died
Something on the path between your monitoring system and a group of devices failed — a switch, an uplink, a router, a WAN circuit, the power feeding a closet. The devices behind it may be perfectly healthy, but your monitoring can no longer see them, so they all go "down" together. This is the classic dead-core-switch storm. And it is the easiest kind to read because the victims share an obvious location: one closet, one building, one site, one subnet. The alerts are mostly the same flavor, too — "host unreachable," over and over.
Service storms: the shared service died
A service that everything quietly leans on — DNS, authentication, NTP, a database — failed. Now dozens of unrelated-looking things are failing in strange ways. This is the subtler storm. When DNS dies, devices still answer pings. But every check that uses a name starts timing out, web checks fail oddly, mail queues back up, and logins hang. In that case, the symptoms are scattered across the whole network and none of them say "DNS" on the label. Service storms are confusing precisely because the victims share no location; what they share is an invisible root. Dependency thinking is the guide to those hidden roots. The short version is that when scattered things fail weirdly at once, ask what they all need rather than where they all live.
Cascade storms: the failure that causes failures
In a reachability storm the children are fine, just invisible. In a cascade, the children are genuinely breaking. The classic example is shared storage: the array stalls, so every virtual machine on it freezes. So every application on those VMs fails, and each layer raises its own real alerts. Cascades are the nastiest storms for two reasons. First, the damage is real at every level. Second, fixing the root does not instantly fix the children. Stalled VMs may need attention even after the array recovers. If alerts keep firing after the parent is healthy again, you are probably cleaning up a cascade.
| Storm type | What failed | The pattern you see | Classic culprit |
|---|---|---|---|
| Reachability | A shared path | Same alert ("unreachable") from one location or subnet | Core/closet switch, uplink, WAN link, closet power |
| Service | A shared service | Varied, weird alerts scattered everywhere | DNS, authentication, NTP, database |
| Cascade | A shared foundation | Real failures stacking layer by layer, lingering after the fix | Storage array, hypervisor, virtualization cluster |
The timing signature: burst vs. bad luck
Before you read a single alert's content, look at the clock. A storm has a fingerprint: the near-simultaneous burst. Dozens of alerts arriving inside the same few minutes, after a quiet stretch, almost always describe one event. The burst is not perfectly instant. Your checks run on polling intervals, so each victim is discovered on its next scheduled poll. The alerts smear across one or two polling cycles. But "forty alerts in three minutes" is a storm signature you can trust.
Contrast that with the slow accumulation of unrelated bad luck: an alert at 9:00, another at 10:20, two more mid-afternoon. Those are probably four separate small problems, and treating them as one story will mislead you. The timing test is your first sorting pass: tight cluster means one cause; scattered timing means separate causes. Occasionally, scattered timing means a slow-burn failure that takes victims gradually — a filling disk, a degrading link. That has its own recognizable rhythm.
One caveat: judge the storm by its front edge, not its tail. Repeat notifications, escalations, and flapping devices can keep an alert stream noisy for an hour after a five-minute event. The moment the storm started — and what fired in its first minute — is where the information lives.
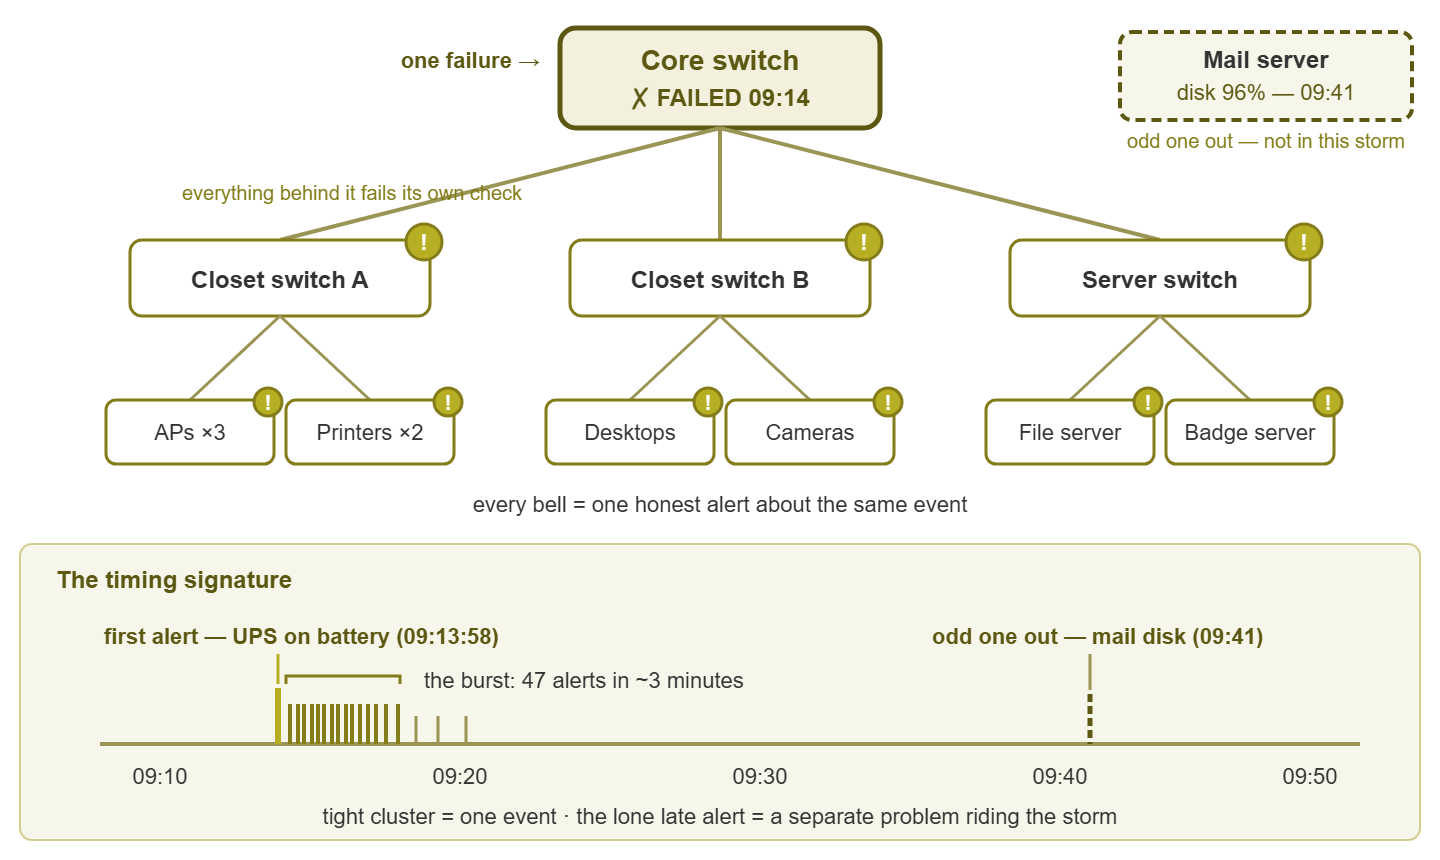
Figure 1: One failure, many honest alerts. The tree shows the blast radius. The timeline shows the burst fingerprint, the earliest alert, and the odd-one-out that does not belong to the story.
Reading a storm's shape
Now the core skill: with the pager still buzzing, you triage the storm by asking three questions in order. Together they usually point at the culprit before you have opened a single device's login page.
Question 1: What fired first?
Sort the alerts by time and study the first sixty seconds. The earliest alerts are often closest to the cause, because the parent tends to fail slightly before its children are discovered missing. A "port down" or "UPS on battery" at 9:13:58 followed by thirty "unreachable" alerts from 9:15 onward is practically a signed confession. Two cautions, though. First, order is only as trustworthy as your clocks. If device clocks and the monitoring server disagree, the sequence lies to you. The guide to timestamp sanity covers why synchronized time is a prerequisite for this kind of reasoning. When in doubt, sort by the time your monitoring server received each alert. That time at least comes from one consistent clock. Second, polling intervals add jitter. A fast-polled child can be discovered before its slow-polled parent. So treat "first" as a strong hint, not a verdict.
Question 2: What shape is the blast radius?
Next, look at where the victims are. Sketch it if you need to — on paper is fine. If everything alerting lives in one closet, one subnet, one building, or one site, you are looking at shared infrastructure. That means the switch, uplink, or power that serves that container. If the victims are scattered across the whole network with no geographic logic, you are looking at a shared service. In that case, your suspect list is the short one from the service-storm section: DNS, authentication, storage, and friends. This is exactly the mental map described in the network visibility mental model. Knowing what sits behind what is what turns a wall of hostnames into a shape. The question to keep asking: what do all of these have in common?
Question 3: What doesn't fit?
Finally, hunt for the odd one out — the alert that does not match the pattern. It matters for two opposite reasons. Sometimes the misfit is the cause: among thirty "unreachable" alerts, the one humble "UPS on battery" warning is the parent explaining everything else. And sometimes the misfit is a coincidence rider. For example, a mail server's disk crossing 95% full during your switch outage is a real, unrelated problem. It will be forgotten if you mentally file it under the storm. Either way, the odd one out deserves its own thread of attention. Telling parents from riders is the subject of root cause vs. symptom. For now, the rule is simply: never force a misfit alert into the storm's story.
First moves when the pager melts down
Reading is half the job; the other half is not making things worse while you read. Here is the playbook, in order:
- 1. Don't chase children. The natural instinct is to open the first alert and start troubleshooting that device. In a storm, that instinct is a trap — you will spend twenty minutes proving a printer is unreachable while the core switch stays down. Resist first-alert-first. Ask instead: what single failure would explain most of this screen?
- 2. Find the parent. Run the three reads: earliest alerts, blast-radius shape, odd one out. Then test the top suspect directly — can you reach the closet switch, is the WAN link up, does DNS answer? One targeted check beats fifty sympathetic ones.
- 3. Mute with intent. Once you are confident the storm is one event, it is legitimate to temporarily silence the affected group. The aim is to let new information be heard over the echo. The key phrase is with intent: scoped to the blast radius, time-boxed (thirty to sixty minutes), and revisited on a timer. This is the same suppression machinery you use for planned maintenance, pointed at an unplanned event. The guide to maintenance windows & suppression covers the mechanics and the safety rails.
- 4. Declare one incident. Forty-seven alerts are not forty-seven incidents. Open a single incident with a single owner and hang the alerts off it. That keeps your team working one problem instead of racing each other to fifty. The incident response guides cover roles and timekeeping — the storm-specific point is simply: one event, one incident, one narrative.
- 5. Announce the blast radius early. Before you even know the cause, you know the shape — "Building B is offline, investigating". That one sentence to the helpdesk or a status channel prevents thirty duplicate tickets and buys you quiet to work. Communicating impact is allowed to precede diagnosis. It usually should.
Tip: when you mute a storm, set an actual timer — on your phone if nowhere else. A suppression without an expiry is how a "temporary" silence becomes a permanent blind spot, and future-you will not remember to lift it. Time-boxed quiet is a tool; open-ended quiet is a slow-motion outage of your monitoring itself.
Making the next storm smaller
Everything above is manual because storms arrive whether or not your tooling is clever. But storms are also highly compressible. If your monitoring system knows that fifty devices sit behind one switch — a parent-child dependency — it can page you once about the parent. In that case, it can mark the children as collateral instead of alarming about each one. One meaningful alert instead of fifty echoes. Building that knowledge is a practical afternoon project, not an enterprise program. It is the subject of this guide's sibling: building dependency maps that tame alert storms.
And here is the quietly useful habit: every storm is a free lesson in your own topology. After the dust settles, ask what dependency this storm just demonstrated that your monitoring did not know about, and add it. A storm post-mortem does not need a meeting — ten minutes and one new dependency rule per storm compounds fast. Shops that do this find their storms shrinking month by month, not because failures stop, but because the monitoring finally understands what the failures mean.
A worked storm: the 47-alert Tuesday
Let's walk the storm from the introduction properly. Here is the front edge of the alert log, sorted by the monitoring server's receive time. The tail — another thirty-one "unreachable" alerts — is omitted, because as you now know, the tail is echo:
09:13:58  WARN   UPS-B2          on battery power
09:15:41  CRIT   SW-B2-CLOSET    host unreachable
09:15:44  CRIT   AP-B2-EAST      host unreachable
09:15:52  CRIT   PRN-B2-COPIER   host unreachable
09:16:03  CRIT   SRV-BADGE       host unreachable
09:16:10  CRIT   AP-B2-WEST      host unreachable
09:16:15  CRIT   CAM-NVR-B2      host unreachable
09:16:31  CRIT   SVC-FILESHARE   share check failed (timeout)
   ...    ...    (31 more unreachable alerts, building B)
09:41:07  WARN   SRV-MAIL        disk C: 96% used
Read 1 — timing. Forty-plus alerts between 9:15 and 9:18, after a quiet morning: that is a burst, so this is one event, not forty problems. Note the receive-time sort — we are trusting one clock, the monitoring server's.
Read 2 — earliest. The first alert is not an "unreachable" at all. It is a humble warning: UPS-B2 on battery, ninety seconds before the flood. Severity says it is the least important line on the screen; timing says it is the most important. (Storms teach this lesson constantly: the loudest alert and the causal alert are usually different lines.)
Read 3 — shape. Every victim's name says building B: the closet switch, its access points, the badge server, the cameras. One container, one flavor of alert — a reachability storm, so the suspect is shared infrastructure in B: the closet switch or what feeds it. The file-share check is the one scattered-looking victim, and a glance explains it: the share lives on a server in B.
Read 4 — odd one out. Two misfits. The UPS warning fits perfectly once you see it as the parent. Closet B2 lost utility power at 9:13:58. The UPS carried the switch for about ninety seconds. Then the battery gave out and everything behind the switch went dark. And the 9:41 mail-server disk warning? Wrong time (23 minutes after the burst), wrong place, wrong kind. It is a coincidence rider — a real problem that gets its own ticket, not a seat in this incident.
The verdict, one line: closet B2 lost power; UPS battery exhausted; switch SW-B2-CLOSET down; all of building B unreachable behind it. Time from first buzz to that sentence: about four minutes, and the only tools involved were sorting by time and knowing the topology. The fix was a tripped breaker. The forty-seven alerts were, every one of them, telling the truth — the skill was hearing them as one sentence instead of forty-seven.
The storm-reading checklist
Pin this next to your monitor — storms have a way of arriving before coffee does:
- Check the clock first. Tight burst = one event. Scattered timing = separate problems.
- Sort by receive time. Study the first sixty seconds; the parent often fires first — and may be a lowly warning.
- Sketch the blast radius. One closet/site/subnet → shared infrastructure. Scattered everywhere → shared service (DNS, auth, storage).
- Ask what the victims share. One answer that explains everything beats fifty investigations.
- Flag the odd one out. It is either the parent in disguise or an unrelated rider — never force it into the story.
- Test the suspect directly. One targeted check on the presumed parent.
- Mute with a timer, declare one incident, announce the impact. In that order.
- Afterwards: harvest the dependency. Every storm reveals a relationship your monitoring should know about.
Storm literacy is the foundation the rest of this pillar builds on. From here, dependency mapping teaches your tools to collapse storms for you. The guide to manual correlation by time and place sharpens the reads you practiced here into a repeatable method. And root cause vs. symptom goes deep on picking the alert that explains the rest. The full set lives at Alert Correlation & Root-Cause Thinking.
Put this into practice with SysPeep Monitor
The storms in this guide get dramatically smaller when your monitoring understands your topology. SysPeep Monitor lets you define dependencies between devices. So when a core switch fails you get one meaningful alert instead of fifty echoes. SysPeep Monitor's auto-discovery also helps you find what is behind what in the first place. The free trial installs on any Windows machine in minutes.
Download Free TrialLearn About SysPeep - All Rights Reserved.