
Response-Time Decomposition: Splitting a Slow Request into Its Parts
The ticket says "the app takes six seconds to open a customer." One number. One number is enough to start an argument and nowhere near enough to finish one. Six seconds could be a tired database, a saturated WAN link, a resolver that has stopped answering, or a browser choking on its own add-ons. Everyone in the room has a favorite suspect, and the network admin's favorite suspect is usually assigned to them by everyone else.
The way out is to stop treating a request as one number. Every request is a short story with a fixed sequence of chapters, and each chapter is owned by a different part of the system. Split the six seconds along those boundaries and the argument mostly evaporates, because the biggest chapter points at its owner without anyone guessing. That splitting is response-time decomposition, and it is the habit I would teach first.
By the end of this guide you will know the six segments of a request and what each depends on. You will know three ways to measure them with tools you already have. You will also know how to turn the numbers into a "pie chart of blame," and what the common shapes of that pie mean.
In this guide
- One request, six segments
- What each segment depends on
- Measuring the segments with three tools
- The pie chart of blame
- Typical shapes and what they mean
- The segment-to-owner table
- A worked example, start to finish
- Things that fake a segment
- Where to go next
One request, six segments
Picture ordering dinner from a restaurant you have never used. First you look up its address (that is DNS, the lookup that turns a name like crm.example.com into an IP address). Then you dial and wait for someone to pick up (the TCP connect, a three-message handshake that opens a reliable channel). Then you agree to speak privately, which takes a little back-and-forth. (That is the TLS handshake, where encryption is negotiated and the server proves its identity with a certificate.) Then you say your order (the request is sent). Then the kitchen cooks, and you hear nothing until the first plate is ready. (That is server think time, the wait for the first byte of the response.) Then the driver carries the food to your door (content transfer). Finally you unpack it and set the table (client render, the browser or app turning bytes into a screen). Nobody blames the driver for the kitchen. In restaurants, anyway.
Those steps collapse into six timed segments, because sending a normal request is tiny and gets folded into the wait. Every web application, every API call, and most client-server programs follow this sequence, in this order, every time; only the width of each segment changes. That fixed order is what makes decomposition possible.
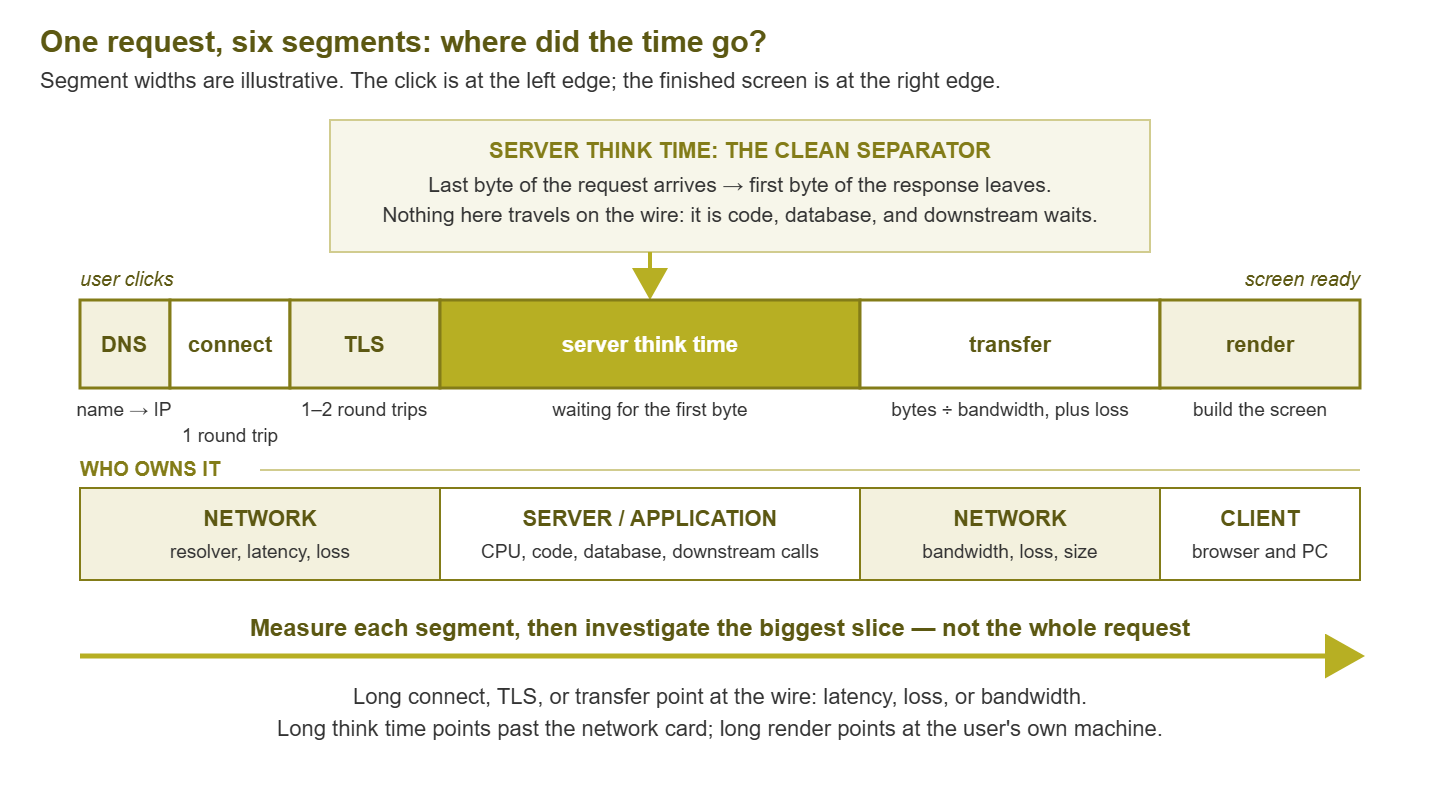
Figure 1: The six segments of a request and who owns each one. Think time is the segment that never touches the wire, which is why it separates application slowness from network slowness so cleanly.
A web page is many requests, each with its own six segments. When you decompose "the page is slow," you decompose the request on the critical path. That is usually the first one, or the data call that takes longest. In that decomposition, you treat the request count as a separate question, covered in this topic's guide to chatty applications.
What each segment depends on
DNS lookup
Depends on the resolver the client uses, whether the answer is cached, and the path to that resolver. A slow DNS segment almost never involves the application server; it is your resolver, your forwarders, or a client pointed at a dead server.
TCP connect
TCP connect costs exactly one round trip on a healthy path. It is answered by the server's operating system before the application is consulted, so it is the purest latency measurement you can get. If a lost packet hits the handshake, the retry waits for a timer measured in whole seconds, so one dropped packet becomes a multi-second stall. A connect segment far longer than a ping to the same server is a network finding, full stop.
TLS handshake
One or two more round trips plus cryptographic work on both ends. It grows with latency, like connect, but also when the server's CPU is overloaded or the client must fetch certificate status elsewhere. A TLS segment much larger than two connect segments hints at server CPU or certificate plumbing rather than the wire.
Server think time
The gap between the last byte of the request arriving and the first byte of the response leaving. (Sending a typical request is one small packet and effectively free; only uploads make it a real segment.) Nothing in think time travels on your network. It is code executing, a database answering (or not), a lock being waited on, a downstream service being called, or a CPU that is simply busy. It is the segment that splits the two halves of this topic's title, and it has its own guide on server think time.
Content transfer
Content transfer is response size divided by effective bandwidth, plus whatever packet loss adds through retransmission. It also includes the ramp-up period in which TCP is still feeling out how fast it may send. A long transfer for a small response points at loss; a long transfer for a huge response may just be physics.
Client render
Everything after the last byte arrives: parsing, running scripts, laying out the screen, and any further requests the page decides to make. It depends on the user's machine, the browser, its extensions, and how much work the application pushes onto the client. A render segment that differs wildly between two PCs on the same page is a client finding.
Measuring the segments with three tools
Three tools you already have give the segments from different vantage points; use two on the same request; they check each other.
Browser developer tools
Every mainstream browser ships a developer panel with a network tab. Reload the slow page with it open and you get a "waterfall": one row per request, with a bar showing when it started and ended. Click a row and a timing view breaks the bar into named phases that map almost exactly onto the six segments. Those phases include DNS lookup, connection, secure handshake, and a phase called "waiting" or "time to first byte" (think time, seen from the client). They also include "content download" (transfer). (Each browser names the phases differently. None of them consulted the others.) Anything before DNS — labeled queueing, stalled, or blocked — is the browser waiting for a free connection slot, a client-side cost. Render is not a phase of any one request. It is the gap between the main document's last byte and the moment the page becomes usable.
A command-line timing request
Command-line HTTP tools can print a timing breakdown for a single request: a number you can repeat from different machines and paste into a ticket. The command below is illustrative; names depend on the tool, but the idea is universal: ask when each segment finished, then subtract neighbors.
curl -s -o /dev/null -w "dns %{time_namelookup}  connect %{time_connect}  tls %{time_appconnect}  firstbyte %{time_starttransfer}  total %{time_total}\n" https://crm.example.com/customer/4471

dns 0.021  connect 0.066  tls 0.158  firstbyte 4.902  total 5.083
Those figures are cumulative seconds, so the segments are the differences. DNS took 21 ms, connect 45 ms (66 minus 21), and TLS 92 ms (158 minus 66). The server thought for 4,744 ms (4,902 minus 158), and transfer took 181 ms. The tool's other switches are covered in the layers of a single web check. This tool cannot show render. It never draws anything, so the client segment is missing by design — which is a feature when you want to exonerate or convict the client. If the command line says two seconds and the browser says six, the missing four are being spent on the user's machine.
A packet capture
A capture taken on the client, the server, or a mirrored switch port between them gives you the segments as raw timestamps. Nothing interprets them. The handshake packets mark connect; the encrypted setup that follows marks TLS. The request packets and the first response packet bracket think time; the last response packet ends transfer. Reading those packets, and spotting the retransmissions that inflate transfer, is taught in reading TCP conversations. For decomposition you need only the timestamps in the table below.
| Segment | Browser timing view | Command-line timing | In a capture |
|---|---|---|---|
| DNS | DNS lookup phase | name-lookup time | DNS query to DNS answer |
| Connect | Initial connection phase | connect minus name-lookup | SYN to SYN-ACK |
| TLS | Secure handshake phase | app-connect minus connect | first hello to handshake finished |
| Think time | Waiting / time to first byte | start-transfer minus app-connect | last request byte to first response data |
| Transfer | Content download | total minus start-transfer | first to last response data packet |
| Render | Gap after the last byte until usable | not visible | not visible |
The pie chart of blame
Once you have the six numbers, turn them into shares of the total. Nobody needs an actual pie — a column of percentages is fine — but the idea of a pie forces one question: which slice is biggest? That slice is where the investigation starts, and the tiny slices are where it does not. Most wasted effort in slow-app incidents is a team working hard on the sliver it happens to own.
- Step 1: Measure the same request at least three times. A segment that is huge once and tiny twice is a different clue from one that is huge every time.
- Step 2: Write down all six segments in milliseconds and add them. If the user says six seconds and your segments sum to two, something you are not measuring — usually render, or a second request — owns the difference.
- Step 3: Convert each segment to a percentage of the total. Round freely; the point is rank order, not decimals.
- Step 4: Name the owner of the biggest slice using the table further down. If it is think time, the network is not the first stop. If it is connect or transfer, it is.
- Step 5: Compare against a healthy baseline if you have one. A think time of 400 ms may be the biggest slice and also normal for that page. The pie says where the time went; the baseline says whether that is new.
Tip: measure from where the user sits. A decomposition taken from a server in the same rack as the application proves nothing about the branch office that complained. If you cannot be at the user's location, run it on their PC over a remote session, or from a monitoring probe placed at that site.
At Northgate Retail a ticket titled "network latency, tills" had been open for five weeks when someone decomposed one request from a shop-floor PC. Connect was 40 ms, TLS 85 ms, transfer 60 ms, and think time 4,000 ms. And the think time was the same from a PC in the server room. The five weeks had gone on upgrading two branch circuits, which the closing note described as "beneficial regardless." The database owner found the query that walked the whole stock table in an afternoon.
Typical shapes and what they mean
After a few dozen decompositions you start recognizing shapes the way a mechanic recognizes engine noises. There are four common ones, plus a fifth that is a different problem in disguise.
Network-heavy. Connect and TLS are large for the distance, and transfer is large for the response size. The tell-tale ratio: TLS is roughly one to two times connect, because both are just round trips. The path is long, lossy, or full; ping and traceroute, the WAN link's utilization graph, and error counters are the next stops. The four-zone method in isolating the slow layer walks outward from the client to find the zone responsible.
Server-heavy. Connect is a few milliseconds, TLS is proportional, transfer is quick, and think time is the whole pie. This is the shape that exonerates your network in one screenshot. It does not say what the server is doing, but it says where the time is, and that is the handoff.
Client-heavy. Every network and server segment is modest, the command-line measurement is fast, and yet the browser takes seconds after the last byte arrives. The shape changes between PCs and between browsers on the same PC. Suspect extensions, security software inspecting the page, an overloaded machine, or an application that does enormous work in the browser.
Many small requests. Every individual request decomposes beautifully and the page still takes ten seconds because there are three hundred of them in a row. No segment is guilty; the count is. This is chattiness, and it makes a healthy network look slow in proportion to its latency.
| Shape | Dominant segment | First suspect | Quick confirmation |
|---|---|---|---|
| Network-heavy | Connect, TLS, transfer | Latency, loss, link saturation | Connect far above a normal round trip; link graph near capacity |
| Server-heavy | Think time | Database, code, downstream calls, CPU | Same think time when measured from the server's own console |
| Client-heavy | Render | Browser, extensions, endpoint load | Command-line timing fast; another PC fast |
| DNS-heavy | DNS | Resolver, forwarders, client DNS settings | Fast when addressed by IP or after the first try |
| Many small requests | None; the count | Application design meeting latency | Hundreds of short rows in the waterfall, strictly sequential |
The segment-to-owner table
This is the table to keep near your desk. "Owner" means the team that should look first, not the team that is guilty. Several segments are shared, and the honest column is the one that says so.
| Segment | Owner | Shared with | What the owner checks |
|---|---|---|---|
| DNS | Network / infrastructure | Client (resolver settings) | Resolver response time, forwarder health, cache behavior, client's configured servers |
| Connect | Network | Server (a listener too busy to accept) | Round-trip time, loss, firewall state tables, backlog on the server port |
| TLS | Network and server | Client (certificate checks) | Round trips, server CPU, certificate chain and status lookups |
| Request sent | Network | Client (upload size) | Upstream bandwidth and loss for large uploads |
| Think time | Server / application | Nobody on the wire | Query times, locks, thread and connection pools, downstream APIs, CPU, memory pressure |
| Transfer | Network | Server (response size, compression) | Bandwidth, loss, retransmissions, whether the response is far bigger than it needs to be |
| Render | Client | Application (work pushed to the browser) | PC resources, extensions, security scanning, amount of script the page runs |
Two rows trap people. A server so overloaded that it cannot accept new connections inflates connect. So if connect is slow while ping is fast, look at the listening port before blaming the path. And an application that sends a multi-megabyte response for a screen showing ten fields makes transfer slow by design. The symptom is on the wire; the fix is on the server.
A worked example, start to finish
The numbers below are made up for teaching, not statistics about any real system; yours will differ, and the method is what transfers.
The ticket: "Opening a customer record in the CRM takes about six seconds from the branch office. It used to be instant." You connect to the user's PC, open the browser's network tab, and reload the customer page three times. The main request's timings are consistent, and the median run looks like this:
Segment          Time (ms)   Share of total
DNS lookup            30         0.5%
TCP connect           45         0.7%
TLS handshake         95         1.6%
Request sent           5         0.1%
Waiting (think)    4,900        81.6%
Content transfer     180         3.0%
Render (measured)    750        12.5%
-----------------------------------------
Total              6,005       100%
Read it as a story. DNS was cached and fast. Connect is 45 ms, matching a ping from the branch to the data center. So the path is behaving; a lost handshake packet would have cost seconds, not tens of milliseconds. TLS is roughly two connect segments, as it should be. Then the request went in and the server said nothing for almost five seconds. Transfer took a fraction of a second, and the browser spent three quarters of a second building the screen — noticeable, but not the story.
The pie is unambiguous: think time is more than four fifths of the total. Before handing that off, do one more thing that costs two minutes and prevents a week of argument. Run the command-line timing from a machine at headquarters, a few milliseconds from the server.
dns 0.002 connect 0.003 tls 0.011 firstbyte 4.810 total 4.834
From next door, connect is 1 ms and TLS is 8 ms — and think time is still 4.8 seconds. The branch's extra forty milliseconds per round trip explain a few hundred milliseconds at most. The rest lives inside the server wherever the request comes from. Your handoff to the application owner is one table and one sentence: "Time to first byte is about 4.8 seconds from both the branch and headquarters; the network segments total under 200 ms; the wait is between request arrival and first response byte." No accusation, and everything they need.
Now imagine the same ticket with a different pie. Think time is at 300 ms and transfer at 4,200 ms for a response of several megabytes. That is the network-heavy shape: the server answered promptly and the wire took four seconds to carry the answer. Your next stops would be the branch link's utilization graph and error counters. You would also have a question for the application owner about why a customer record weighs several megabytes. Same ticket, opposite direction.
Things that fake a segment
- Warm connections. Browsers reuse open connections, so a second request to the same server skips DNS, connect, and TLS entirely. Compare cold with cold; if one run shows 150 ms of setup and the next shows zero, the door was simply already open.
- Proxies and load balancers. With a proxy in front of the application, "think time" as seen by the client includes the proxy's own wait for the backend. It is still not your wire, but it may be the proxy's wire. Measuring again from behind the proxy splits that.
- Caches. A cached response has tiny think time and can make a sick server look healthy. Make sure the request you time actually reaches the application — a fresh record, or a cache-bypass option.
Where to go next
One number starts the argument. Six numbers with owners attached finish it, and that is all decomposition is. The layered diagnosis workflow shows where it sits in the sequence from scoping to handoff. The guide to server think time goes deep on the segment that matters most. And working with app owners shows how to package those numbers so the other team can act. All of them start from the Application Slowness vs. Network Slowness pillar.
Put this into practice with SysPeep Monitor
Decomposition tells you which segment to investigate; the graphs tell you whether that segment was normal yesterday. SysPeep Monitor keeps the network side of the story on record. That includes latency and loss to your servers, WAN link utilization, and server CPU and memory over SNMP and WMI. So when the pie points at connect or transfer you can open the chart instead of guessing. The free trial installs on any Windows machine.
Download Free TrialLearn About SysPeep - All Rights Reserved.