
Client, LAN, WAN, or App? Isolating Where the Slowness Lives
The complaint is confirmed and scoped. The ten-minute intake routine from Someone Says the Network Is Slow gets you that far. Now comes the real question: where is it? Between a user's finger on the mouse and the answer appearing on their screen sits a long chain of hardware and software. Any link in it can be the slow one. I have lost whole afternoons poking at that chain at random.
The fix is a mental model, not a tool. Divide the chain into four zones — the client, the LAN, the WAN, and the application. Run one cheap test at each boundary. Every test has only two outcomes: it clears the zone behind it, or it does not. Clean results push the suspect outward. The first dirty result names the zone where you stop and dig. Instead of one enormous question (“why is the network slow?”), you answer three or four small ones with yes or no.
This guide gives you the model and the tests for each zone, with the results that rule it in or out. It gives you a decision tree you can follow under pressure and two worked examples that catch very different culprits. None of it needs special equipment: a command prompt, a stopwatch, and your monitoring graphs cover nearly everything.
In this guide
- The four-zone model
- Zone 1: the client itself
- Zone 2: the LAN — your building
- Zone 3: the WAN — the edge and beyond
- Zone 4: the application and its server
- The decision tree
- Two worked examples
- When two zones conspire
- Where to go next
The four-zone model
Picture the path from the complaining user to the thing they are using. Zone 1, the client: their computer — its CPU, memory, disk, and its first hop onto the network via cable or Wi-Fi. Zone 2, the LAN (local area network): everything inside your building — access points, switches, cabling, and the uplinks between them. Zone 3, the WAN (wide area network): your edge router or firewall and the links beyond it — the internet connection, or the private circuit to another site. Zone 4, the application: the server or cloud service at the far end, with its own CPU, disk, and database that can crawl while every network cable between you shines.
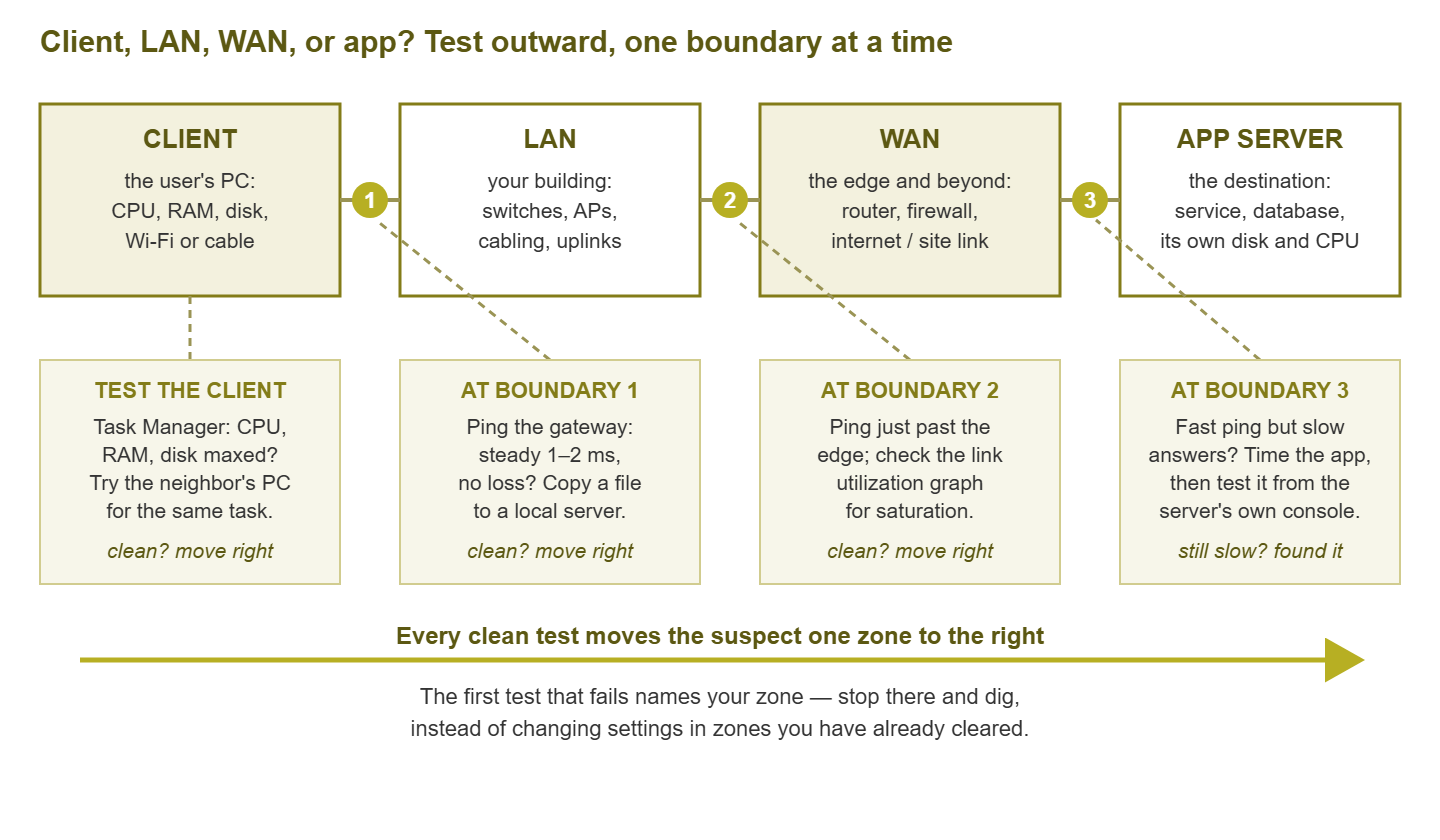
Figure 1: The four zones and the test at each boundary. Every clean result moves the suspect one zone to the right; the first failed test names where to dig.
The model stretches to fit whatever path your user actually takes. For a cloud application, zone 3 is the internet and zone 4 is a provider's service you cannot log into. For that path, both are still testable from your side. For a branch-office worker using a head-office server, zone 3 is the site-to-site link. There is also a second LAN — the server's — hiding inside zone 4. For someone on a VPN from home, their house is an extra client-side zone you can only test by proxy. Draw the chain for this user before testing; it takes ten seconds and prevents testing the wrong path entirely.
Two rules make the model work. First, test outward from the user, in order. The zones close to the user are the cheapest to test and, for single-user complaints, the most likely culprits. So you harvest the easy answers first. Second, stop at the first dirty result. If the gateway ping is already ugly, nothing you measure beyond the gateway means anything. In that case, every packet to the outside world crosses that damaged first stretch. So the far tests inherit its problems. This is the mistake that wastes the most time in practice: blaming the ISP for latency that started three meters from the user's desk.
Zone 1: the client itself
A healthy share of “network” slowness lives on the reporting machine. A laptop with its CPU pinned, its memory exhausted, or its disk grinding at full tilt makes everything feel slow. The network gets blamed because the network is invisible and the spinning cursor is not.
Test: open the machine's resource view — Task Manager on Windows (right-click the taskbar), or top on Linux and macOS terminals. Look at CPU, memory, and disk while the slowness is happening. Anything sitting near its ceiling is a suspect. Check the little things with outsized effects too: antivirus mid-scan, an update downloading, a cloud sync client uploading someone's photo library, or a browser with ninety tabs. On Wi-Fi, check the signal indicator and, crucially, ask which network they are on. That is because a laptop that silently hopped to the guest network is a common cause of one-user slowness.
The cross-check that settles it: perform the same slow task from the machine next to theirs, on the same kind of connection. This “second machine test” is the single most powerful move in the zone, because it isolates the client perfectly. Neighbor fast and reporter slow means the problem is on or very near the reporter's machine. In that case, the network beyond their port is cleared in one move. Both slow? The client is ruled out, and you move right.
Zone 2: the LAN — your building
The LAN's boundary test is the humble gateway ping. The default gateway is the router address your machine sends everything to when the destination is not local — the door out of the building. A ping to it travels across the user's cable or Wi-Fi and through the local switching, and nothing else. That makes its round-trip time a pure measurement of your LAN path.
C:\> ping -n 20 192.168.1.1

Reply from 192.168.1.1: bytes=32 time=1ms TTL=64
Reply from 192.168.1.1: bytes=32 time=1ms TTL=64
Reply from 192.168.1.1: bytes=32 time=2ms TTL=64
...
    Packets: Sent = 20, Received = 20, Lost = 0 (0% loss)
    Minimum = 1ms, Maximum = 3ms, Average = 1ms
That is what health looks like on a wired LAN: single-digit milliseconds, barely varying, nothing lost. (Wi-Fi runs a little higher and jumpier — a handful of milliseconds with the odd spike is normal.) Send twenty pings rather than the default four; intermittent trouble hides from small samples. Two ugly patterns matter. High or wildly varying times — tens to hundreds of milliseconds to a device in the same building — suggest a congested or failing local path. That might be an overloaded access point, a saturated uplink, or a duplex mismatch (two ends of a cable disagreeing about how to talk, a classic that produces errors under load). Lost packets to your own gateway are never normal and point at cabling, a sick switch port, or radio interference. The tests for chasing loss specifically live in the packet loss guides.
Corroborating tests: ping another machine on the same LAN (rules the gateway itself out). Copy a large file to a local server and watch the transfer rate. And — if you run monitoring — look at the error counters and utilization on the user's switch port and the uplinks. A rising error counter on one port is what turns “mysterious slowness” into “replace this cable.” (Keep spare cables. Keep several.)
Zone 3: the WAN — the edge and beyond
If the LAN tests are clean but anything beyond the building is slow, you are at the WAN boundary. Two different questions hide here, and they have different tests. Question one: is the path beyond the edge slow or lossy? Ping something just past your router — your ISP's gateway or a reliable public address like 1.1.1.1. Compare against your normal. This is where knowing your typical numbers pays off enormously; a reading means little until you compare it with a baseline. A traceroute (tracert on Windows), which lists each router hop along the path with its round-trip time, shows roughly where added delay begins. Near hops are yours, and far hops are the world's:
C:\> tracert www.example.com

  1     1 ms     1 ms     1 ms  192.168.1.1       <-- your gateway: LAN is fine
  2     9 ms     8 ms    10 ms  100.64.10.1       <-- ISP's first router: link is fine
  3    95 ms    92 ms   118 ms  203.0.113.45      <-- delay appears out in the provider's network
  4    97 ms    96 ms   120 ms  198.51.100.7
Read it for the step: the hop where times jump and stay jumped. A single slow hop with fast hops after it is usually just a router that answers pings at low priority while forwarding traffic fine — a famous traceroute trap. Delay that appears at one hop and persists to the destination is real.
Question two — and usually the better bet: is your own link simply full? A saturated internet or site-to-site link is among the most common causes of everyone-at-once slowness. When a link runs at capacity, traffic queues at the edge device, and queueing delay makes every application feel sticky at the same time. The test is not a ping but a graph: your edge interface's utilization during the complaint window. Pinned at the top means you have found it. In that case, your next question becomes who or what is filling the pipe, and whether that is a one-off or the new normal. Links do not fill themselves; something on your network is doing it, and it has a hostname. For how full a link can run before users feel it, see how full is too full.
When the WAN itself is genuinely the slow zone, you may need to chase the delay deeper. That means going hop by hop, with the right interpretation of noisy traceroute output. It is a discipline of its own, covered thoroughly in troubleshooting high latency.
Zone 4: the application and its server
Here is the pattern that identifies zone 4, and it is worth memorizing: fast ping, slow answers. The round trip to the server is a crisp few milliseconds. Packets are not being lost, and file copies to the same server run at full speed. And yet the application takes fifteen seconds to open a record. The network is delivering messages promptly; the thing at the far end is slow to compose its replies. That is not a network problem, whatever the ticket says.
Tests that rule the app zone in: first, time the layers separately. A ping to the app server measures the network path. Opening a trivial static page or a small file from the same server measures the server's front door. The real transaction — the search, the report, the record open — measures the whole stack. Network fast, front door fast, transaction slow: the problem is deep in the application or its database. Second, check the server's own vitals: CPU, memory, and above all disk activity, the habitual bottleneck of application servers. Third, the elegant closer: run the app on the server itself (at its console or over a remote session). Still slow with no network in the loop at all? The network is formally acquitted — a result worth capturing in writing, because it converts an argument into a fact.
Cloud services need a variant, since there is no console to visit. Substitute the other-network test: try the same service from a connection that does not share your infrastructure — a phone on cellular data is perfect. Slow from your office but fast from cellular points back toward your zones 2 and 3. Slow from both places points at the provider (or the service's own status page, which is always worth ten seconds). You cannot fix a provider's bad day, but distinguishing “their problem” from “our problem” changes everything about what you do and say next.
Tip: DNS deserves a special mention because it imitates every other zone. If looking names up is slow, every connection starts with a multi-second stall and then runs at full speed. Users describe that, reasonably, as “the network being slow.” The tell: pinging an address like 1.1.1.1 is instant, while pinging a name pauses noticeably before the first reply. When you see that, investigate your DNS servers before anything else.
The decision tree
Under pressure, run this sequence exactly. Each step assumes the previous ones came back clean:
- 1. Client busy? Check Task Manager and try the neighbor's machine. Reporter slow, neighbor fast → client zone: dig into that PC, its cable or Wi-Fi, its switch port. Both slow → continue.
- 2. Gateway ping ugly? Twenty pings to the default gateway. High, jumpy, or lossy → LAN zone: check the access point or switch, port errors, uplink utilization. Clean → continue.
- 3. Edge link full, or far ping slow? Check WAN utilization graphs; ping just beyond the edge; traceroute if needed. Saturated or slow → WAN zone: find what fills the link, or work the latency problem. Clean → continue.
- 4. Fast ping, slow answers? Time the transaction versus the network; check the server's CPU and disk; test at the server's console. Slow there too → application zone: server resources, database, or the app itself.
- 5. Everything clean but complaints persist? Widen the sample: more users, other times of day. You may be chasing an intermittent problem. Capture evidence while it is live (see the evidence kit) and consider whether the pattern is chronic rather than acute.
For reference, the tests and verdicts in one place:
| Test | Healthy looks like | Unhealthy looks like | Zone implicated |
|---|---|---|---|
| Task Manager on the client | CPU/RAM/disk with headroom | Anything pinned at its ceiling | Client |
| Same task on neighbor's PC | Equally slow (problem is shared) | Fast next door, slow here | Client |
| 20 pings to default gateway | Low single digits, 0% loss | Spiky times or any loss | LAN |
| File copy to a local server | Fast, steady transfer | Slow or sawtooth transfer | LAN (or that server) |
| WAN interface utilization | Comfortable headroom | Flat-topped at capacity | WAN |
| Ping/traceroute past the edge | Near your baseline | Far above it, or rising loss | WAN / provider |
| Ping name vs. ping address | Both start instantly | Name pauses, address instant | DNS |
| Transaction at server console | Fast without the network | Slow even locally | Application |
Two worked examples
Example one: a single user, everything slow. A designer reports that everything crawls. Neighbor test: the person one desk over is fine — suspect zone 1 already. Task Manager looks calm, though. Gateway ping from the designer's laptop: replies of 40, 200, 15, 600 milliseconds with a couple lost. That is wildly jumpy for a machine three rooms from the gateway. From the neighbor's machine: a steady 3 ms. Same LAN, different experience — so the shared LAN is cleared, and the suspect is this laptop's path onto it. It turns out to be Wi-Fi: the laptop clung to a distant access point instead of the near one. Forgetting and rejoining the network fixed it. Total tool budget: ping and a neighbor.
Example two: everyone, one application. Order-entry is slow for every site, reported within the same half hour. Scope says shared service, and the zone walk confirms it fast. Clients: fine everywhere (many machines, many buildings — zone 1 cannot explain it). Gateway pings at two sites: clean. WAN graphs: comfortable, and other traffic — email, web — feels normal, which quietly clears zones 2 and 3. Ping to the app server: a crisp 2 ms. Fast ping, slow answers — zone 4. The server's graphs show disk activity pinned since mid-morning; on the console, even a local query drags. The culprit is a runaway report job flooding the database with reads. Four tests, and the network was never involved; you can show that in writing before anyone asks.
When two zones conspire
Real problems occasionally refuse to stay in one box, and it is worth knowing the common pairings. A client-zone process — one machine running an unthrottled cloud backup — can saturate the WAN link and hurt everyone. In that case, the symptom is zone 3, and the cause is zone 1. An application in zone 4 that starts timing out can trigger storms of retries that light up the WAN. And a lossy LAN port on the server's side of the building produces perfect tests from your desk and misery for everyone else. Remember that the server has a zone 1 and 2 of its own, mirrored on the far side. The method still works in every case; you simply may pass through one zone's symptoms to find another zone's cause. Follow the evidence outward, and when a link is full, ask what filled it before asking for a bigger link.
At Meridian Parts the branch office slowed to a crawl every afternoon for three weeks. The WAN graph was flat-topped from two until five. By the second week a meeting had been convened to discuss a bigger circuit. Nobody had yet asked what was filling the one they had. When somebody did, it was one laptop syncing forty gigabytes of product photographs to a cloud drive, a little every afternoon after lunch. The fix took four minutes. The meeting had taken an hour, and it had been booked to recur.
Where to go next
Four zones, four boundary tests, one rule: stop at the first dirty result. Run them in order and the afternoon that used to vanish into random poking becomes twenty minutes and a written answer. With the intake routine in front of this method and disciplined evidence capture behind it, you have the spine of the whole playbook. The rest of the guides in “The Network Is Slow”: A Diagnostic Playbook build outward from here. They include the questions that sharpen vague reports and telling sudden breakage from creeping degradation.
Put this into practice with SysPeep Monitor
Half the tests in this guide are really questions to a graph. Is the uplink saturated? Is the server's disk pinned? Do port errors line up with the complaint? SysPeep Monitor collects those numbers continuously over SNMP and WMI and puts every zone's vitals on one dashboard. So the zone walk takes minutes, not meetings. The free trial is a quick install on any Windows machine.
Download Free TrialLearn About SysPeep - All Rights Reserved.