
Troubleshooting High Round-Trip Times: A Decision Tree
"The network is slow." Four words, no numbers, no location, no time frame — and somehow it is now your problem. The instinct under that kind of pressure is to start testing everything at once: ping a few things, reboot something, stare at the firewall. Sometimes that works. Usually it burns an afternoon proving things that were never in question.
High latency yields to structure better than almost any other network complaint. One early question — who is affected, and to where — instantly eliminates most of the network from suspicion. This guide is that structure: a decision tree you can walk under pressure. First you scope the complaint into one of four branches. Each branch then gets its own first test, its own way of reading the result, and its own fix or escalation. At the end there is a one-page table version to print and pin up, plus the classic traps that make smart people chase the wrong hop.
In this guide
- Step 0: Scope the complaint
- Branch A: One user or device
- Branch B: Everyone, to everywhere
- Branch C: Everyone, to one destination
- Branch D: One internal segment
- The classic traps
- The one-page flow summary
Step 0: Scope the complaint
Before touching a single tool, ask three questions. Each answer cuts the search space roughly in half, so ninety seconds of asking saves hours of testing:
- Who is affected? One person? One floor, VLAN, or building? Everyone? "Everyone" claims deserve a spot check — users generalize from a sample size of themselves.
- To where? Everything they touch, or one application or site? "Everything is slow" and "the CRM is slow" are entirely different investigations.
- When? Always? Only at certain hours? Only when something big is running — a backup, a sync, month-end? "Under load only" practically names the culprit by itself.
Then convert the feeling into a number, because "slow" is not measurable and 240 ms is. Run a real test from an affected machine to an affected destination: a few dozen pings, noting average, worst case, and any loss. Compare it against what that path should measure. If you keep baselines, this is their moment. If you do not, the expected-latency reference supplies sane numbers by path type. The guide to measuring latency honestly covers the measurement craft itself. A complaint that measures normal is also progress: the problem is real but living somewhere other than round-trip time.
The answers drop you into one of four branches:
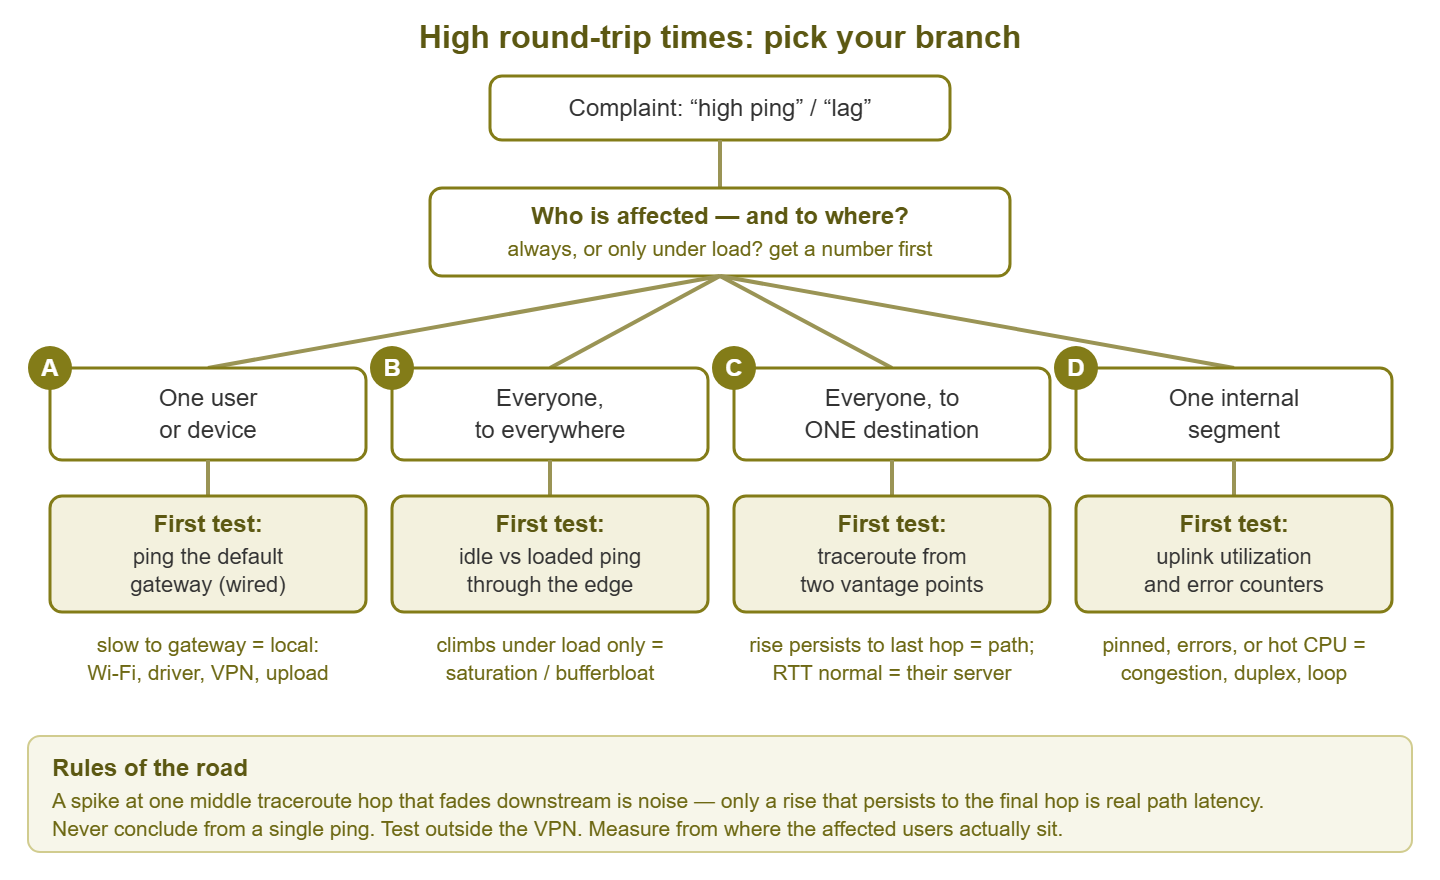
Figure 1: The whole playbook on one screen: scope first, then run the one test that opens the right branch.
Branch A: One user or device
One affected machine means the cause is almost certainly local: the device, its Wi-Fi, its path onto the network, or something it is doing to itself. But first, spend sixty seconds confirming the scoping, because "only me" reports are self-selected. Reproduce the complaint from a second device on the same switch or access point. If the neighbor is slow too, you are really in Branch B or D and just saved yourself an hour of blaming an innocent laptop. Neighbor fine? Then work outward from the machine.
First test: ping the default gateway
From the affected machine, ping the local router — the default gateway, the first device all its traffic crosses (find its address with ipconfig on Windows):
ping -t 192.168.1.1

Reply from 192.168.1.1: bytes=32 time=1ms TTL=64
Reply from 192.168.1.1: bytes=32 time=1ms TTL=64
Reply from 192.168.1.1: bytes=32 time=1ms TTL=64
Wired, this should sit at 1–2 ms, rock steady. On healthy Wi-Fi, a few milliseconds with modest wobble. If the very first hop is slow or erratic, the problem lives between this machine and the wall, and the internet is exonerated. If the gateway is clean but far destinations are slow, the machine's path is suspect — VPN first.
The local suspects, in order of likelihood
- Wi-Fi signal. Check signal where the user actually sits:
netsh wlan show interfaceson Windows reports a signal percentage. Below roughly 60–70%, weak signal forces retransmissions and lower data rates, which arrive as latency and jitter. The clinching test: ping the gateway over Wi-Fi, then over a cable from the same spot. Cable clean, wireless ugly — it is a radio problem (coverage, interference, or one sad access point). - A background upload. A cloud backup or sync client quietly saturating the uplink queues everything else the machine sends. Open Task Manager's network column (or Resource Monitor) and look for the busy process. This is bufferbloat in miniature, scoped to one machine. If the upload saturates a shared link, one laptop can drag a whole office into Branch B.
- The VPN path. A VPN can hairpin traffic through a distant concentrator: the user in one city, the VPN gateway in another, the destination back near the user. Every packet makes the grand tour. Compare RTT to the same destination with the tunnel up and down (policy permitting), or against a neighboring machine without the VPN. If the tunnel adds most of the delay, the fix is routing policy (split tunneling, a closer gateway), not hardware.
- Driver and power settings. Aggressive power saving on wireless adapters — and on some NICs — parks the radio between packets. The wake-up tax lands as tens of milliseconds of jitter. Check the adapter's power-management options and driver version, especially on laptops that are "only slow on battery." USB adapters and dodgy docks belong on this list too.
Branch B: Everyone, to everywhere
Everything slow for everybody points at what everybody shares: the edge of your network and the ISP link behind it. Three suspects, tested in order.
First test: idle versus loaded ping
Ping a stable external target when the WAN link is quiet, then while it is busy (or make it busy with a large transfer). Idle fine but loaded terrible is the signature of a saturated link with an oversized buffer — bufferbloat. It has a dedicated playbook of its own: the loaded-latency test and the queue-management fixes. Check the utilization graphs for the same windows. If latency spikes ride on top of a pinned link, find what fills it. Backup schedules and cloud sync are the usual elephants. Manage the queue rather than just adding lanes.
Second suspect: the edge device itself
Routers and firewalls forward packets with finite CPU, and a box running hot adds delay to everything crossing it. Suspects include deep-packet inspection, too many rules, an underpowered appliance on an upgraded circuit, or a device quietly failing. Check its CPU and memory (web interface, or SNMP if you monitor it) during the bad windows. A useful comparison: ping the firewall's inside interface, then something just beyond it. Milliseconds appearing across the box, on an unsaturated link, indict the box.
Third suspect: the ISP — and the evidence to collect
If the link is not saturated and the edge box is healthy, the problem may be past the demarcation point. Before calling the provider, collect what their first-line support will otherwise spend forty minutes asking for:
- Run continuous timestamped pings to the first hop past your equipment, long enough to cover a bad spell. Look for high or erratic RTT at their first device, from an unloaded link.
- The same to a stable far target, showing the problem persists beyond the first hop.
- When it started, whether it correlates with weather or time of day, and your idle-versus-loaded results proving it is not your own saturation.
On shared access technologies, evening-hours latency that your own utilization graphs cannot explain is neighborhood congestion. It is frustrating, but far easier to escalate with a week of timestamped evidence than with "it feels slow at night."
Branch C: Everyone, to one destination
Everything local is fine, but one destination — one SaaS app, one branch, one server on the internet — is slow for all users. The cause is on the path to that destination or at its far end. And your job is mostly to determine whose problem it is.
First test: traceroute, read correctly
Traceroute maps the path by coaxing each router along it into replying in turn, and reports the RTT to every step. The reading skill is knowing that only one pattern matters. Look for the hop where latency jumps and then stays high all the way to the end.
tracert app.example.net    (output trimmed to one probe per hop)

  1     1 ms   192.168.1.1        <-- your gateway: fine
  2    12 ms   100.64.17.1        <-- ISP first hop: fine
  3    13 ms   core1.isp.example
  4    89 ms   peer.ix.example    <-- jump of ~75 ms appears here...
  5    91 ms   transit.example
  6    90 ms   app.example.net    <-- ...and persists to the end: real
Here the path is clean until hop 4, then every subsequent hop — including the destination — carries the extra 75 ms. That is a genuine path problem beginning around hop 4. Now compare the number against what this path should cost from the baselines reference. A reading of 90 ms to another continent is Tuesday. A reading of 90 ms to a server two towns over means routing has gone sightseeing. Sometimes that is literal, when a path detours through a distant exchange point.
Then run the same traceroute from a second vantage point — home connection, a phone hotspot, a cloud VM. Both paths bad: the problem is near the destination, and the evidence goes to its operator. Only the office path bad: the problem is on your side or your ISP's route, and both traces go into that ticket instead.
Or is it their server, not the network?
If ping and traceroute to the destination measure normal while the application is still slow, stop blaming the road. The network is delivering packets on time and the far end is slow to answer. The tell is the gap between connection and response — the connection opens fast (network fine) while the answer crawls (server thinking). Users experience server think-time and network delay identically, but the fix lives in completely different hands. The guide to anatomy of a round trip dissects where a transaction's milliseconds actually go and how to tell the parts apart. Handing a SaaS vendor a clean traceroute plus a slow response time is a far stronger ticket than "your app is slow."
Branch D: One internal segment
One floor, one closet, one VLAN lags — even to internal servers — while the rest of the network is happy. The cause sits in the shared infrastructure of that segment: its switch, its uplink, or its cabling. Three classics account for nearly all of it.
A congested uplink
Forty-eight access ports funneling into one uplink is a fine ratio — until the day it is not. Check the uplink's utilization during the bad windows via your monitoring or the switch's own counters. A queue on a pinned uplink is queuing delay for the whole closet. Climbing output drops (ifOutDiscards) on that port are its fingerprint. The fix is capacity (a faster uplink, aggregated links) or moving the heavy talker. The diagnosis, as ever, is knowing which counter was climbing while users complained.
A duplex mismatch
The old classic: one end of a link hardcoded to full duplex, the other left on auto. By the rules of autonegotiation, the auto end falls back to half duplex. The link works, slowly and dirtily: the half-duplex side logs late collisions, the full-duplex side logs FCS/CRC errors, and every collision means retransmission delay. Idle, it seems fine; under any real load, latency and loss soar. Check error counters on both ends of the suspect link. The cure is setting both ends to auto (or both hardcoded, if forced by ancient gear — never mixed).
A hot switch CPU — and the trap hiding inside it
Ping the segment's switch and see 80 ms — case closed? Not so fast. A switch forwards user traffic in dedicated hardware but answers pings with its little management CPU, which treats them as the lowest of priorities. A busy CPU makes pings to the switch slow while forwarding through the switch stays perfect. So test both: ping the switch, and ping a healthy device across it. Slow to it but clean through it — a cosmetic curiosity. Genuinely slow through it, with the CPU pegged, means trouble worth chasing. It could be a broadcast storm or loop (look for a port with runaway broadcast counters and for spanning-tree topology changes). Or it could be a switch pressed into routing duties in software. The broadcast-storm case is the one that truly flattens a segment — every host processes every broadcast. And the storm eats the CPU that should be running the closet.
The classic traps
Three mistakes account for most wrong turns in latency hunts. All three produce confident, wrong conclusions.
- Reading traceroute hop by hop like a scoreboard. A middle hop showing 200 ms while later hops show 20 ms is not a bottleneck. It is a router answering traceroute with its deprioritized management CPU while forwarding your actual traffic at full speed. Ignore any spike that vanishes downstream. The same logic works in reverse. The final hop is the only line that measures the full journey your traffic takes. So judge the path by where a rise begins and persists to the end. And remember the rise only localizes the problem to somewhere at or after that hop. Return-path congestion and invisible, non-replying hops are folded into the same numbers.
- Testing over the VPN. A tunnel adds encryption overhead, a detour through the concentrator, and sometimes fragmentation — measuring through it measures the tunnel, not the network. Unless the complaint is specifically about the VPN, test outside it. If you cannot, say so in your notes before someone orders a circuit upgrade to fix a VPN routing policy.
- Single-ping conclusions. One ping is one sample. The first often includes address-resolution overhead; any one can catch a momentary queue. Latency is a distribution: run dozens, look at average, worst case, and loss together, and only then conclude. One 300 ms reply in a sea of 12s is trivia. A steady 5% of replies at 300 ms is a real pattern that average-only reporting would hide.
Tip: the fourth trap is testing from your own desk over conference-room Wi-Fi and calling it data. Test from where the affected users are, wired if they are wired — or at least note the difference. Half the contradictory measurements in any incident come from mixing vantage points.
The one-page flow summary
| Scope answer | First test | If it shows… | Likely cause | Action |
|---|---|---|---|---|
| One user or device | Ping the default gateway from that machine | First hop slow or erratic | Wi-Fi signal, adapter power saving, background upload | Wired-vs-wireless test; check signal, drivers, Task Manager |
| One user, gateway clean | Same destination with VPN down, or from a neighbor machine | Only the tunnel path is slow | VPN hairpin or distant concentrator | Split tunneling / closer gateway; escalate to VPN owner |
| Everyone, everywhere | Idle vs loaded ping through the edge | Latency climbs only under load | Saturated link, bufferbloat | Queue management; find the elephant flow |
| Everyone, everywhere — even idle | Edge CPU check; timed pings to ISP first hop | Hot edge box, or slow first hop | Overloaded edge device, or ISP fault | Fix or resize the box; ISP ticket with timestamped evidence |
| Everyone, one destination | Traceroute from two vantage points, vs baseline | Rise begins mid-path, persists to the end | Path or provider routing issue | Escalate with both traces |
| Everyone, one destination — RTT normal | Compare connection time vs response time | Network fast, answers slow | Far-end server, not the network | Evidence to the app or server owner |
| One internal segment | Uplink utilization and error counters on its switch | Pinned uplink, drops, collisions/errors, hot CPU | Congested uplink, duplex mismatch, loop or storm | Upgrade or aggregate uplink; fix duplex both ends; break the loop |
Where to go next
The tree works because each question eliminates whole categories before you test anything. Scope first, one branch, one test, one reading, then fix or escalate with evidence. What makes it work fast is history — knowing what normal looked like and when it changed. Baselines turn "is 40 ms bad?" into a lookup. Continuous measurement turns "when did it start?" from an interview question into a graph. If this playbook felt useful, its prerequisite chapters are the baselines reference and measuring latency honestly. The rest of the Network Latency topic fills in the physics behind every branch you just walked.
Put this into practice with SysPeep Monitor
Every branch of this tree leans on evidence: when the latency started, which link was full, whose CPU was hot. SysPeep Monitor collects exactly that around the clock. It auto-discovers your network, graphs interface utilization, errors, and device CPU over SNMP and WMI, and alerts on thresholds. When the lag ticket arrives, the history is already on a dashboard instead of being reconstructed from memory. The free trial installs on any Windows machine in minutes.
Download Free TrialLearn About SysPeep - All Rights Reserved.