
Anatomy of a Round Trip: Where the Milliseconds Go
Someone clicks Submit in the internal web app and watches a spinner for two full seconds. They file the ticket you have read a hundred times: "the network is slow today." Maybe it is. But that two-second wait was not one thing — it was a stack of phases, each with its own cause, owner, and fix. A name lookup, two handshakes, a request, a server thinking, a response crossing the wire, a browser drawing pixels. Blaming "the network" for the total is like blaming the highway for a late pizza without checking whether the kitchen took forty minutes.
This guide dissects one click into its timed parts, with realistic numbers that actually add up. You will see the same click twice — once fast, once slow — and find out where the difference really lived. That is usually not where people assume. Along the way you will meet the round trip: the currency everything is priced in. By the end you will be able to point a free tool at any slow app. You will be able to say, with numbers, which phase ate the milliseconds — and therefore who needs to fix it.
In this guide
- The round trip: the currency everything is priced in
- The seven stops between click and pixels
- The same click, fast and slow
- Where the difference actually lived
- Why "the network is slow" is usually mis-filed
- Watching the phases yourself: dev tools and curl
- The three-question triage
- Where to go next
The round trip: the currency everything is priced in
Two definitions, and then everything else follows. Latency is delay: the time between asking for something and getting it. The round-trip time, or RTT, is the most useful measure of it. It measures how long a message takes to travel from your machine to another machine and back. When you run the ping command and it reports time=42 ms, that 42 milliseconds is an RTT — out and back, one lap.
Here is why RTT matters more than any other number on this page. Network protocols are conversations, full of moments where one side must wait for the other's answer before it can continue. It is like corresponding by postal mail, where the limiting factor is not envelope size but the week each exchange costs. Eleven exchanges, eleven weeks, no matter how large the envelopes. Networks are the same: many steps in loading an app cannot overlap or be skipped. So the wait is RTT multiplied by the number of exchanges, plus the time the server spends thinking, plus the time the data spends flowing.
RTT varies enormously with distance and path. Between two machines on the same switch it is well under a millisecond. Across a typical office LAN, one or two milliseconds. Across a country, often 40 to 80 ms. Through a geostationary satellite, around 600 ms. (The guide on latency baselines by path type gives you the full reference table.) Bandwidth — how much data per second the pipe can carry — is a different quantity entirely. Buying more of it does not shorten a single round trip. That argument gets its own guide in latency vs. bandwidth.
The seven stops between click and pixels
Here is what actually happens between the moment a user clicks a link to your internal web app and the moment the page appears. Seven stops, in order — and notice, as you read, how many are priced in round trips. The example numbers assume a healthy connection with an RTT of 40 ms: say, a branch office reaching a server at headquarters.
Stop 1: The DNS lookup (0 to 200 ms)
DNS (the Domain Name System) is the network's phone book. It turns a name like app.company.example into an IP address the computer can actually send packets to. The browser cannot do anything else until it has that address. The cost varies wildly. If the answer is already cached — in the browser or the operating system — the lookup is effectively free, well under a millisecond. If the local DNS server has it cached, you pay one round trip to that server: a few milliseconds. But a cold lookup of a name nobody has asked for recently means your DNS server itself has to go asking other servers across the internet. And that can take 20 to 200 ms. This is why the first visit of the morning feels slowest: the caches were cold, and that click paid the toll for everyone.
Stop 2: The TCP handshake (exactly 1 RTT)
TCP (Transmission Control Protocol) is the reliable-delivery layer that nearly all web traffic rides on. Before any data can flow, the two machines perform a three-step introduction. Your machine says "hello" (a SYN packet). The server answers "hello, ready" (SYN-ACK). Your machine confirms (ACK) and can immediately start sending. Net cost: exactly one round trip, every time a new connection opens. At 40 ms RTT, that is 40 ms of pure protocol formality before a single byte of your actual request has left the building. There is no clever setting that removes it; it is how TCP works.
Stop 3: The TLS handshake (1 to 2 more RTTs)
TLS (Transport Layer Security) is the encryption layer behind the padlock icon — the reason nobody in the coffee shop can read your traffic. Setting it up is another negotiation. The two sides agree on encryption methods, and the server proves its identity with a certificate. Both derive the keys they will encrypt with. Under TLS 1.2 this costs two additional round trips. TLS 1.3 tightened it to one. And reconnecting to a server you spoke to recently can be cheaper still through session resumption. Call it 40 to 80 ms at our example RTT. Notice the running total: the user has now waited up to three or four round trips and the server has not yet heard the question.
Stop 4: Sending the request (usually a rounding error)
The request itself — "GET /reports, and here are my cookies" — is small, typically well under two kilobytes, which fits in a single packet. On any modern link the time to push those bits onto the wire is microseconds. The request simply rides the outbound half of the next round trip — a rounding error next to the ceremony before it.
Stop 5: Server think-time (1 ms to many seconds — the wildcard)
Now the server has the request and goes to work: runs application code, queries a database or three, maybe calls another service behind it. During all of this the network sits idle. This is the phase with the widest range of any on the page. A cached dashboard might take 5 ms; a gnarly report query might take 8 seconds. And server think-time is the phase most often mislabeled as "network." From the user's chair, waiting is waiting. From your chair, it is the difference between calling the network team and calling whoever owns the database.
Stop 6: The response transfer (size ÷ bandwidth — plus a surprise)
The response — say 300 KB of HTML for the main page — now flows back. Naively this costs size divided by bandwidth: 300 KB on a 50 Mbps link is about 48 ms of actual transmission. But TCP does not trust a new connection with full speed immediately. It starts cautiously — sending roughly ten packets, waiting for acknowledgments, then doubling the amount in flight each round trip. This ramp-up is called slow start. And it means a 300 KB response takes four or five round trips to deliver almost regardless of how fat the pipe is. At 40 ms RTT, that is closer to 190 ms than 48. On long paths, transfer time is often dominated by round trips, not bandwidth.
Stop 7: Rendering — and the encore nobody budgets for
The browser parses the HTML and starts drawing — tens of milliseconds of local CPU work. But while parsing, it discovers the page needs more things: stylesheets, scripts, images, fonts, data from an API. A typical business web app fires 20 to 100 follow-up requests. Each one repeats some subset of the stops above (connections do get reused, mercifully), and some cannot start until an earlier one finishes. One click was never one round trip; it is a small crowd of them. This is the multiplier that turns "40 ms RTT, what's the problem?" into a one-second page load.
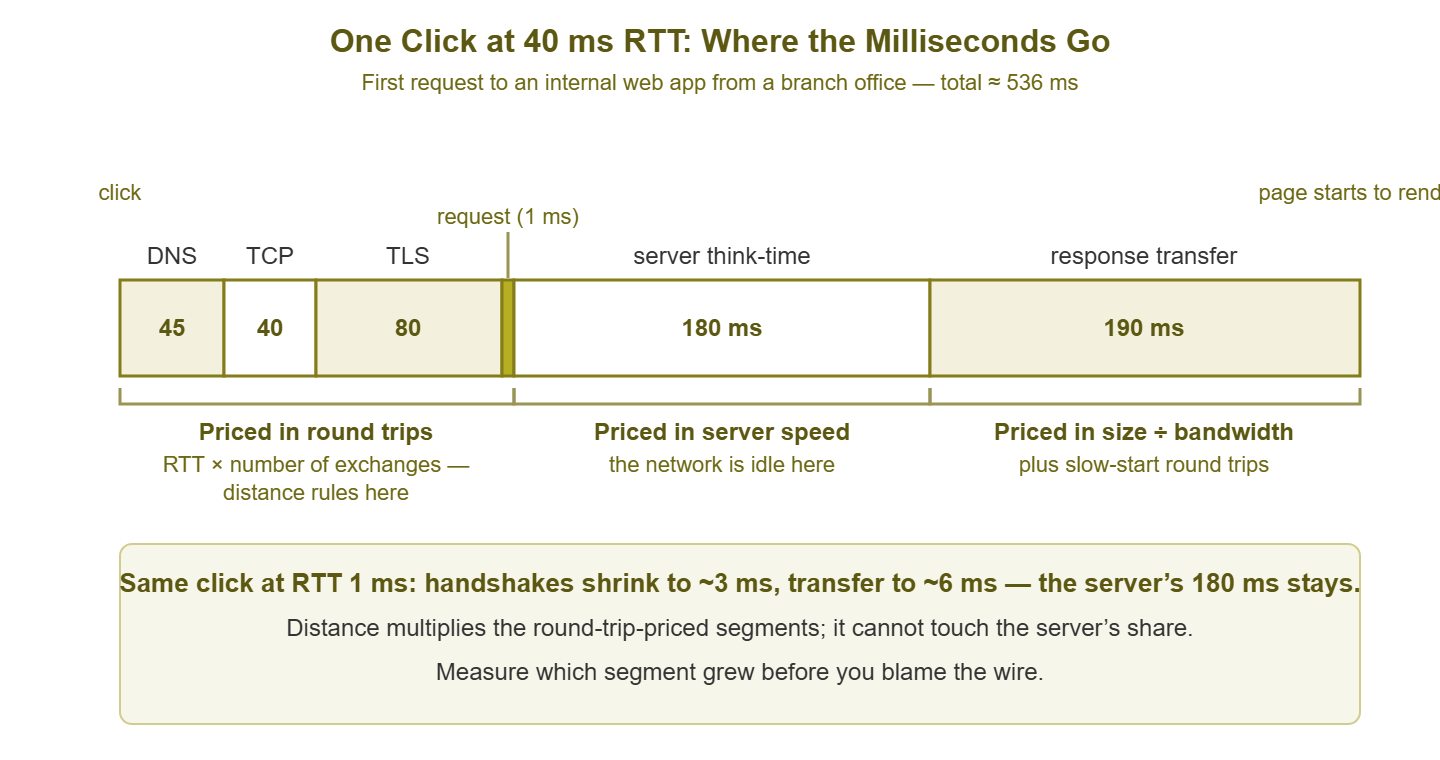
Figure 1: One click at 40 ms RTT, first request only. The left block is priced in round trips, the middle in server speed, the right in size ÷ bandwidth plus slow-start round trips. Different segments, different fixes.
The same click, fast and slow
Now run the numbers twice, honestly. Same internal web app, same server, same page: 300 KB of main HTML plus 28 follow-up assets. The server takes 180 ms to think, both times. Bandwidth is ample in both cases. The only real difference: the first user sits at headquarters on the LAN with a 1 ms RTT to the server. And the second sits at a branch office 40 ms away, with cold DNS caches. First, the headquarters user:
| Phase | Time | What drove it |
|---|---|---|
| DNS lookup | ~0 ms | Answer cached on the machine |
| TCP handshake | 1 ms | 1 RTT at 1 ms |
| TLS handshake | 2 ms | 2 RTTs at 1 ms |
| Request sent | ~0 ms | One small packet |
| Server think-time | 180 ms | App code and database queries |
| Response transfer (300 KB) | 6 ms | Slow start barely matters at 1 ms RTT |
| Render + 28 follow-up fetches | 65 ms | Local CPU; cheap round trips, mostly parallel |
| Total | ~254 ms | Feels instant; nobody files a ticket |
A quarter of a second, and 180 ms of it — over 70% — was the server thinking. Now the identical click from the branch office:
| Phase | Time | What drove it |
|---|---|---|
| DNS lookup | 45 ms | Cold cache; one trip to the resolver at HQ |
| TCP handshake | 40 ms | 1 RTT at 40 ms |
| TLS handshake | 80 ms | 2 RTTs at 40 ms |
| Request sent | 1 ms | Still one small packet |
| Server think-time | 180 ms | Identical server, identical query |
| Response transfer (300 KB) | 190 ms | ~5 slow-start round trips; only ~48 ms was actual transmission |
| Render + 28 follow-up fetches | 460 ms | Handshakes and request waves, each priced at 40 ms |
| Total | ~996 ms | Feels sluggish; ticket incoming |
Just under one second. The click got four times slower, and every user at the branch would swear the app is "slow." Meanwhile, every user at HQ says it is fine. Both are right. That split, by itself, is a diagnostic. When slowness depends on where the user sits, you are looking at a path problem, not a server problem.
Where the difference actually lived
Subtract the tables: the branch user waited about 742 ms longer. Now audit where it went, because this is the part that defies assumptions. The server contributed zero extra — 180 ms in both runs. Raw transmission contributed almost nothing: bandwidth was fine, and pushing 300 KB accounted for roughly 48 ms of the 190 ms transfer. Nearly the entire difference is one quantity: the round-trip time, multiplied by the number of round trips. Count them in the slow run: one for DNS, one for TCP, two for TLS, one for the request and first byte of response. There are about four extra for slow start, and roughly eight more waves of handshakes and fetches across the follow-up assets. Call it eighteen round trips at 40 ms each — about 720 ms of structural waiting. That is the difference, almost to the millisecond.
Notice what the intuitive fixes would have done. Doubling the branch's bandwidth: shaves maybe 24 ms off one line. Upgrading the server: nothing — it was never the bottleneck here. The levers that actually work on this shape of problem are the ones that reduce RTT or reduce the number of trips. Those include caching DNS and assets locally, reusing connections, or moving the app (or a replica) closer to the branch. Another is an application built to make fewer, larger requests instead of dozens of chatty ones.
And now flip the experiment. Suppose the server think-time had been 2,000 ms because the report query does a full table scan. Both tables would be dominated by one row, and HQ users would grumble too. And no network change of any kind could rescue more than a fraction of the wait. Same complaint, opposite fix. That is why decomposing the click is worth ten minutes of anyone's time.
Why "the network is slow" is usually mis-filed
When a user says "the network is slow," they are reporting a symptom: waiting. In practice that symptom has three common causes, and only one of them is the network's fault. First: the server is slow — think-time dominates, as in our flipped experiment. For internal apps this is the most common case, and it belongs to whoever owns the application and database. Second: the app is chatty and the path is long — forty round trips at 40 ms each. Nothing is broken; the design and the geography just multiply badly. That one belongs to architecture: caching, placement, consolidating requests. Third: the network is genuinely misbehaving — and even this splits in two. Packet loss forces TCP to notice a missing segment and resend it. That can stall a transfer for hundreds of milliseconds per incident (see the packet loss guides). And congestion makes packets sit in queues inside routers, inflating every round trip. The delay-type guide on the four kinds of delay explains queuing, and bufferbloat shows its most dramatic form.
Mis-filing between these three is how a slow-app ticket burns weeks. The network team runs pings, sees a healthy 40 ms, closes the ticket. The app team profiles the server, sees 180 ms, shrugs. Everyone is measuring their own phase and finding it innocent, because nobody measured the whole click. So let us measure the whole click.
Watching the phases yourself: dev tools and curl
You do not need to buy anything to see every phase of this guide with your own eyes. Two free instruments do it.
The browser's developer tools
In any major browser, press F12, open the Network tab, and reload the page. You get a waterfall chart: one bar per request. Clicking a bar breaks it into exactly the phases you now know. Typical labels include DNS lookup, initial connection (TCP), and SSL or TLS. There is also waiting for server response (think-time, often labeled TTFB, time to first byte), and content download. The waterfall also shows the encore: how many follow-up requests fired, and which ones sat waiting for others. Two minutes in this tab answers "chatty or slow server?" faster than any meeting.
curl with timing flags
For scripts, servers without browsers, and clean repeatable numbers, there is curl — a command-line tool for fetching URLs. It ships with current Windows, macOS, and virtually every Linux. It can print a timestamp for each phase using its -w (write-out) flag:
curl -o /dev/null -s -w "DNS done:    %{time_namelookup}s
TCP done:    %{time_connect}s
TLS done:    %{time_appconnect}s
First byte:  %{time_starttransfer}s
Total:       %{time_total}s
" https://app.company.example/reports
A real run against a struggling app might print:
DNS done:    0.046s
TCP done:    0.087s
TLS done:    0.171s
First byte:  0.812s
Total:       1.034s
Each number is a running clock since the command started, so the phases come from subtraction, and each subtraction is a diagnosis. DNS took 46 ms (cold cache). TCP finished at 87 ms, so the handshake took 87 − 46 = 41 ms. Since that handshake costs exactly one round trip, you have just measured the RTT: about 41 ms. TLS took 171 − 87 = 84 ms, almost exactly two more round trips — consistent, nothing wrong there. The first byte of response arrived at 812 ms. Subtract the 171 ms of setup and one round trip of 41 ms for the request to travel and the answer to start back. The result shows that the server sat thinking for roughly 600 ms. There is your villain. The remaining 222 ms was the download. One command, and the ticket now says "app server takes 600 ms to answer /reports" instead of "network slow."
Tip: run the command three or four times and judge the pattern, not the first run. The first pays cold tolls (DNS, full handshakes) that later runs skip. And when a result surprises you, run the same command from a second location, such as the server's own LAN. Slow from everywhere means server; slow from far away only means path.
The three-question triage
Everything above collapses into a triage you can run in five minutes on any "X is slow" report. Three questions, in order:
- 1. Is it far? Measure the RTT to the server — a few pings, or the TCP-handshake subtraction above. The guide measuring latency honestly covers the tools and their traps. Single-digit milliseconds means distance is not the story, and round trips are cheap; skip ahead. Tens of milliseconds or more means every exchange is expensive, and chattiness will multiply it.
- 2. Is it thinking? From the curl output: first byte minus TLS-done minus one RTT. If that number dominates the total — and especially if it dominates from a client on the server's own LAN — the wait belongs to the application or database. In that case, no network change will fix it. Hand the measurement, not the blame, to whoever owns the app.
- 3. Is it chatty? Open the dev-tools waterfall and look at the request count and the shape. Consider dozens of small sequential requests, each one short but queued behind the last, over a long-RTT path. That is the multiplication problem. The levers are caching, connection reuse, consolidation, and moving endpoints closer together.
Suppose all three questions come back innocent — short RTT, quick server, few requests — and it is still slow. Then now you have earned the right to suspect the network itself: loss, queuing, a sick link. That investigation has its own guide: troubleshooting high round-trip times.
Where to go next
You now own the core mental model of latency. One click is a stack of phases; most phases are priced in round trips. The RTT is the exchange rate. And decomposition — not intuition — tells you which phase, which team, and which fix. From here, go deeper on the pieces. The guide the four delay types explains what the RTT itself is made of and which parts of it can be reduced. The guide latency baselines by path type tells you whether the RTT you measured is normal for the distance. And the guide measuring latency honestly turns the quick checks from this guide into a proper test kit. The full set lives on the Network Latency pillar page.
Put this into practice with SysPeep Monitor
A one-off curl run tells you where this click's milliseconds went. Monitoring tells you what changed since last Tuesday. SysPeep Monitor watches response times to your key servers and network gear around the clock. It graphs them alongside device health from SNMP and WMI, and alerts you when a path drifts away from its normal. So the next 'app is slow' ticket arrives with evidence already attached. The free trial installs on any Windows machine in minutes.
Download Free TrialLearn About SysPeep - All Rights Reserved.