
Bufferbloat: The Hidden Latency Killer
Here is a support ticket that has puzzled generations of administrators. "The internet is fine all morning. Then around two o'clock everything falls apart — video calls freeze, remote desktop lags, even web pages hesitate. By four it's fine again." You test: the speed test shows the full rate you pay for, and ping is a crisp 14 ms. Nothing looks broken… and then you notice that two o'clock is exactly when the offsite backup starts uploading.
That pattern — a connection that is perfect when idle and miserable whenever someone moves a big file — has a name: bufferbloat. It is one of the best-kept secrets in networking. It hides inside routers, modems, and firewalls, and never shows up as an outage. It causes a huge share of the "network feels slow" complaints that rebooting never explains.
This guide explains bufferbloat in plain terms. It then gives you a ten-minute test that makes it visible, a grading scale for the results, and the fixes. That includes the one configuration detail that decides whether they work at all. No special hardware: a ping window and one big transfer will do.
In this guide
- Why buffers exist at all
- How a good buffer goes bad
- The symptoms
- The loaded-latency test, step by step
- Reading your results
- The real fix: smart queue management
- Shaping below line rate
- Partial measures
- Verifying the fix
Why buffers exist at all
A buffer is a waiting room for packets. Every device that forwards traffic — router, modem, switch, firewall — has one on each outgoing link, for a good reason: traffic is bursty. Packets arrive in clumps, not a polite even stream. When a clump arrives faster than the outgoing link can send it, the device has two options: hold the extras briefly, or throw them away. A modest waiting room absorbs the burst, keeps the link fully busy, and delivers everything a few milliseconds later.
Think of the line at a coffee shop. A short line is healthy: the barista is never idle, and nobody waits long. The line only becomes a problem when it stretches around the block — and the shop still refuses to tell anyone to come back later. Buffers are not a design mistake; the trouble starts with their size, and with the personality of the protocol that fills them.
How a good buffer goes bad
Most bulk traffic — backups, cloud sync, file copies, video uploads — rides on TCP, the transport protocol that guarantees delivery. TCP has no speedometer and no map of your network. It discovers how fast it can send the only way it can: it accelerates until something tells it to stop. The classic stop signal is a lost packet. Faster, faster… a drop… ease off, creep up again. Loss is the brake pedal. (Newer congestion-control algorithms also watch delay, but you cannot count on the far end of every connection using one.)
Now send a single large, long-lived transfer — an elephant flow, in network slang — through a sensibly sized buffer. The elephant accelerates, the link fills, the small buffer fills a few milliseconds deep, and the device starts dropping. TCP feels the brake almost immediately and settles in around the link's true capacity. The queue stays short; latency barely moves.
Consumer and edge gear, though, often ships with wildly oversized buffers. Memory is cheap, and "never drops a packet" sounds like a virtue on a datasheet. There, the elephant fills the link, then keeps accelerating into the buffer, because no drops are happening. The buffer absorbs a tenth of a second of data. Half a second. A full second or more. Only when it is completely full does the first drop occur. TCP promptly climbs again, so the buffer refills and stays essentially full for the entire transfer. Engineers call this a standing queue: a traffic jam that persists as long as the elephant runs.
How bad can that get? Queuing delay is simple arithmetic: bytes ahead of you, divided by the link speed draining them. Suppose a modem buffers 1 MB on a 10 Mbit/s upload. One megabyte is 8 megabits; 8 divided by 10 is 0.8 seconds. Every packet crossing that link now waits up to 800 ms — on a connection whose idle ping is 14 ms. (Queuing is one of the four fundamental delay types — the four delay types guide covers the other three.)
And here is the truly unfair part. A basic buffer is strictly FIFO — first in, first out, one single line. The queue does not care that your voice packet is 200 bytes carrying 20 milliseconds of someone's sentence. Nor does it care that your DNS lookup is one tiny question blocking a whole page load. Everything — ping, keystroke, "can you hear me?" — waits its full turn behind hundreds of 1,500-byte upload packets. The elephant is not even being greedy on purpose. The buffer simply lets it stand in everyone's way.
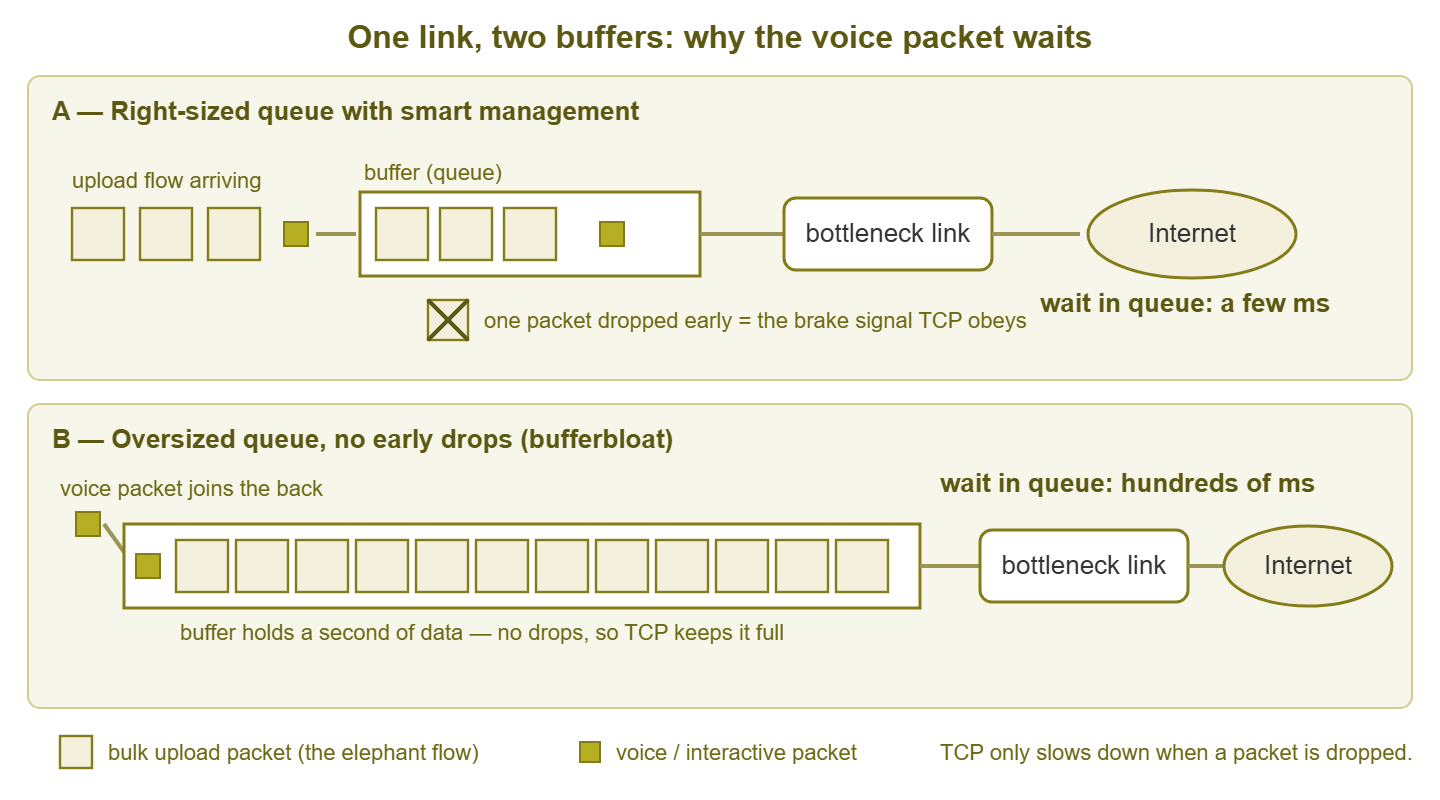
Figure 1: Same link, two buffers. The small, managed queue drops one packet early — the brake signal — and stays short. The oversized queue never signals, so TCP keeps it full. Every packet, including the tiny voice packet at the back, pays the full waiting time.
The symptoms: perfect when idle, awful under load
Bufferbloat has a signature, and once you know it you will spot it everywhere:
- Idle ping is great; loaded ping is terrible. The defining symptom. The connection measures 14 ms at lunch and 600 ms while the backup runs. So any diagnosis done while the link is quiet finds nothing wrong.
- Calls die when transfers run. Video meetings freeze or robotize the moment a large upload starts or a cloud sync client catches up. When the transfer ends, quality snaps back.
- One person can lag the whole site. A single laptop uploading video can make every other user's session crawl, because everyone shares the same bloated bottleneck queue.
- Speed tests look great anyway. A classic speed test measures throughput, and many report a ping measured before the load started. So both numbers can look perfect on a badly bloated line.
- Upload saturation hurts worst. On asymmetric links the upload rate is a fraction of the download rate, so an upload queue drains slowly and the delay is biggest. If lag appears whenever anything uploads, suspect the upload queue first.
If you keep utilization graphs on your edge router, complaints will line up with the windows where the link pins at 100%. Whether a full link is itself a problem has its own guide, how full is too full. Bufferbloat is why a full link so often feels catastrophic rather than merely busy.
The loaded-latency test, step by step
The principle: measure latency while the link is deliberately saturated, and compare it to latency while the link is idle. The difference is the queue. You need two windows on one machine — one pinging, one loading — and ten minutes.
Step 1: Pick a ping target
Choose something close and stable: ideally the first router beyond your own equipment, which isolates your access link. Find it with a quick tracert (Windows) or traceroute (Linux/macOS) to any internet host. That target is the first hop that is not your own gear. Any steady, nearby host works too. Below, replace 203.0.113.1 with your target.
Step 2: Measure the idle baseline
Pick a quiet moment with no big transfers running and let a ping run for about sixty seconds:
# Windows (runs until you press Ctrl+C, then prints a summary)
ping -t 203.0.113.1

# Linux / macOS (60 samples, then a summary)
ping -c 60 203.0.113.1
Note the average and the maximum. A healthy idle baseline:
--- 203.0.113.1 ping statistics ---
60 packets transmitted, 60 received, 0% packet loss
rtt min/avg/max/mdev = 13.6/14.4/19.2/1.1 ms
Step 3: Saturate the upload — while the ping keeps running
Leave the ping running and start the biggest upload you can. Real work is fine: kick off the offsite backup manually, or copy a multi-gigabyte file to cloud storage. With a server across the WAN, iperf3 gives a clean, controllable load:
# Saturate the upload direction for 60 seconds
iperf3 -c server.example.net -t 60

# Same test in the download direction (the server sends to you)
iperf3 -c server.example.net -t 60 -R
Step 4: Read the pings during the load
Give the transfer ten seconds to reach full speed, then watch the pings. On a bloated link the change is not subtle — replies that were 14 ms arrive at 300, 500, 800 ms, sometimes with drops mixed in:
--- 203.0.113.1 ping statistics ---
60 packets transmitted, 58 received, 3% packet loss
rtt min/avg/max/mdev = 96.4/412.7/780.3/143.9 ms
Step 5: Repeat for the download direction
Downloads queue in the other direction — in the ISP's equipment and the modem's downstream buffer. So test it separately with a large download (a multi-gigabyte OS image is traditional) or the -R variant of iperf3, ping still running.
Step 6: Compute the added latency
For each direction: loaded average minus idle average. Above, 412 − 14 ≈ 400 ms of added latency. That delta — not the absolute number — is your bufferbloat measurement.
Worth knowing: several reputable browser-based speed tests now include a latency-under-load or "responsiveness" measurement, sometimes shown as a bufferbloat letter grade. They automate exactly this procedure and make a fine quick check; the manual version works anywhere, and you control every variable.
Tip: run the test from a wired machine. Wi-Fi adds its own variable delay (and can bloat too, inside the access point), muddying the measurement of the broadband link. And warn colleagues before deliberately flattening the office connection — or at least pick lunchtime.
Reading your results: how much added delay is too much
Grade each direction separately — a terrible upload often coexists with a merely mediocre download. These bands are practical judgment, not an official standard, but they match how real-time applications actually feel:
| Added latency under load | Verdict | What it feels like |
|---|---|---|
| Under 30 ms | Excellent | Calls and remote sessions survive heavy transfers; most users never notice the link is busy |
| 30–100 ms | Acceptable | Occasional stutter in video calls during big transfers; remote desktop feels slightly rubbery |
| 100–400 ms | Poor | Classic bufferbloat: voice breaks up and screen shares freeze whenever the link is loaded |
| Over 400 ms | Severe | Calls drop, typing echoes a second late, users report the connection as "down" during transfers |
Two footnotes. First, a bloated queue does not add a steady delay. It swings, and that variation (called jitter) is what actually murders voice quality. Second, a little loss during the loaded test is normal and even healthy — loss is the brake signal. Huge delay with almost no loss is the classic bloat signature: the buffer absorbing everything instead of signaling. Loss without a latency rise points somewhere else — see the packet loss guides.
The real fix: smart queue management
First, the fix that isn't: buying more bandwidth. A faster link drains its queue faster, so an upgrade softens the symptoms. But TCP elephants expand to fill whatever pipe they find, and the oversized buffer at the bottleneck still fills and still stands. You will have spent real money to move from "awful under load" to "bad under load." The problem is queue behavior; the fix is queue management.
Smart queue management (often abbreviated SQM) is the umbrella name for modern queueing algorithms. The two you will meet are fq_codel ("fair queuing with controlled delay") and CAKE, its more automated successor. Strip away the math and they do two things:
- Drop early. The algorithm watches how long each packet has been waiting. When waits exceed a target of a few milliseconds, it drops (or marks) an occasional packet while the queue is still tiny. TCP gets its brake signal seconds earlier, backs off, and the standing queue never forms.
- Share fairly. Flows are separated into their own small sub-queues and served round-robin, so the elephant mostly queues behind itself. Your 200-byte voice packet gets its own lane and slips across almost immediately.
"Deliberately dropping packets" sounds like vandalism. It is not. A few early drops are precisely the signal TCP was built to obey. And the sender retransmits instantly; the alternative was everyone's packets waiting most of a second. A packet that sat 800 ms in a modem buffer was not "saved" — it was just late. In practice the elephant still gets essentially full throughput, and queue delay stays in single-digit milliseconds.
Many business firewalls and routers ship this under names like "smart queue" or "SQM," and it is a headline feature of the popular enthusiast router firmwares. Configure it on the interface facing the bottleneck — almost always the WAN.
The detail that makes or breaks it: shaping below line rate
Here is the step people skip before concluding that SQM "doesn't work." A queue manager can only manage a queue that forms inside its own box — and queues form at the bottleneck. If your router forwards at gigabit speed toward a modem that uplinks at 20 Mbit/s, the bottleneck is the modem. In that case, the queue forms in the modem's buffer. Your router's elegant fq_codel manages a queue that is always empty while the modem bloats merrily out of reach.
The cure is to make your smart box the bottleneck on purpose, using a shaper. A shaper is a rate limiter that is part of every SQM setup. Set it slightly below the link's true rate in each direction. Now packets queue in your device, where the algorithm sees them. The modem's buffer stays empty because traffic arrives just under the rate it can drain. You give away a small slice of throughput to win back hundreds of milliseconds. It is the best trade in networking.
Picking the numbers is empirical:
- 1. Measure real throughput at a quiet hour — several runs, each direction. Not the marketing rate; the measured rate.
- 2. Set the shaper to about 85–90% of measured rate, both directions.
- 3. Rerun the loaded-latency test. Added latency should collapse.
- 4. Nudge the shaper up a few percent at a time, retesting, until added latency starts creeping — then step back one notch.
One honest complication: this works cleanly when the line rate is constant. Cable at peak hours, LTE and 5G, and DSL lines that retrain all move the true capacity around. On variable links, shape conservatively or use gear whose shaper auto-adjusts. And download shaping is inherently a little less precise. You are persuading remote senders to slow down rather than directly metering them. So a slightly higher after-fix number on the download side is normal.
When you can't fix the box: partial measures
Sometimes SQM is not available: the edge device lacks support, or the ISP's locked combo box does the routing. In rough order of usefulness:
- Classic priority QoS. Old-style quality-of-service can mark and prioritize known traffic — typically voice — so it jumps the queue. This genuinely protects the phones, but the unmarked majority still waits behind the elephant. A partial shield, not a cure.
- Throttle the elephants at the source. Nearly every backup and sync product has a bandwidth cap and a schedule. Capping the client below the link rate is a poor man's shaper applied to the single worst offender, and moving elephants to overnight windows costs nothing.
- Bridge the ISP box. If the bloat lives in an ISP-supplied router you cannot configure, ask for bridge mode and put your own SQM-capable router behind it. Satisfying diagnostic: if shaping your box below the line rate fixes the latency, the queue lived in their box.
- Ask about newer equipment. Some access technologies now build active queue management into the modem itself; a modem swap or firmware update from the ISP occasionally fixes upload bloat outright.
Verifying the fix — and keeping it fixed
Rerun exactly the same loaded-latency test — same target, same load, same directions — and put the numbers side by side. A typical before/after on a 100/20 Mbit/s connection, shaped to roughly 90%:
| Measurement | Before | After SQM + shaping |
|---|---|---|
| Idle ping (average) | 14 ms | 14 ms |
| Ping during full upload | 620 ms | 28 ms |
| Ping during full download | 190 ms | 32 ms |
| Added latency, upload direction | 606 ms | 14 ms |
| Added latency, download direction | 176 ms | 18 ms |
| Upload throughput | 19.6 Mbit/s | 17.9 Mbit/s |
| Download throughput | 97 Mbit/s | 90 Mbit/s |
Read the trade honestly: about 7 Mbit/s of download and 1.7 of upload bought a roughly twentyfold cut in loaded latency. Nobody will ever notice the missing megabits; everybody notices that calls now survive the backup window. The table is also what to show whoever approves changes — it turns "I tuned the router" into evidence.
Fixes do not always stay fixed, so close the loop: retest after firmware updates and always after a speed-tier change. A shaper set for a 20 Mbit/s upload becomes a silly self-imposed cap once the ISP moves you to 50. And a line-quality drop that pulls the real rate below your shaper puts the queue back in the modem and brings the bloat roaring back. If lag complaints return at busy times, you now own a ten-minute test that settles the question.
Where to go next
The story in one breath: buffers exist to smooth bursts. Oversized, unmanaged buffers absorb seconds of queue instead of dropping early. TCP keeps pushing until it sees loss, so the queue stands. And every packet — including the tiny urgent ones — waits behind the elephant. The loaded-latency test makes it visible, smart queue management makes it gone, and shaping just below line rate makes the management actually engage.
To go deeper: the four delay types guide gives you the full physics of queuing and its siblings. The guide on measuring latency honestly covers the craft of measurement beyond ping. And the latency baselines reference tells you what your idle numbers should look like in the first place. The rest of the Network Latency topic ties it all together.
Put this into practice with SysPeep Monitor
Bufferbloat only shows itself when a link is loaded — so knowing exactly when your links saturate is half the diagnosis. SysPeep Monitor auto-discovers your routers and firewalls. It graphs interface utilization and device health over SNMP and alerts you when a link pins at capacity. That lets you see the saturation windows behind the lag complaints and confirm your fix is holding. The free trial installs on any Windows machine in minutes.
Download Free TrialLearn About SysPeep - All Rights Reserved.