
The NOC Wall: Designing a Screen Read From Across the Room
There is a television on the wall of most IT offices. On it is a dashboard that somebody built with care and that nobody has read in months. I have built three of those screens. Each one started useful and each one turned into decoration. That was because I designed it the way I design a screen for myself — sitting down, up close, with a mouse. I then hung it on a wall where none of those things are true.
A wall screen is a different object from a desk dashboard. It is read by a room, not a person; from three metres, not thirty centimetres; in passing, not on purpose. Every design decision follows from those three facts, and most of what makes a good desk dashboard makes a bad wall one.
By the end of this guide you will be able to lay out a wall screen a stranger can read from the door. You will be able to pick the right panel for each service and decide what red is allowed to mean. You will be able to prove to the room that the screen is still alive, and keep off it the things that never belonged there. There is a plain-text layout template and a tile specification table you can copy into your own build.
In this guide
- What a wall screen is for
- The reading-distance test
- Tiles over graphs
- Size and contrast rules
- What red is allowed to mean
- Refresh and the freshness marker
- What never goes on a wall
- The layout template
- The wall screen checklist
- Where to go next
What a wall screen is for
A wall screen exists so that a room notices a change, not so that a person studies a picture. That sounds like a small distinction and it decides everything else in this guide. A person studying a screen can lean in, hover, read a legend, and think. A room noticing a change needs one thing only. When something breaks, the screen must look different from how it looked a minute ago, from anywhere in the room.
The definition this whole library uses is that a dashboard answers one question, for one audience, at a glance. And the guide on what dashboards are for names the three audiences: the wall, the admin at a desk, and management. This guide covers the design craft of the first one only. Which few screens deserve to exist at all is a different question, and dashboards that earn their place answers it.
The wall's question is "is anything broken right now?" and nothing else. A NOC (network operations centre) is the room where that question is asked all day. In a small organisation it is the corner of the IT office with the television in it. There, "the room" is whoever happens to be walking past. The screen does not need to explain what is broken or why. It needs to make someone turn their head.
A good wall screen is boring nearly all of the time. Twelve green tiles, the same twelve, all day. New admins find this disappointing and try to make it more interesting with graphs. Resist. A wall screen that is interesting is a wall screen with a problem on it.
The reading-distance test
The test is simple: stand at the door and read a service name off the screen. Not the colour, the name. If you can say "the file server tile is green" from the doorway, the screen passes. If you can only say "the third one along is green", it fails, because in six weeks nobody will remember which service that is.
Run the test with the room's real lighting and the real door. A screen looks enormous when you are standing under it and small from the far side. Do it at the hour the blinds are open, too. A television that reads perfectly at eight in the evening can be a grey mirror at two in the afternoon.
How big is big enough? People who make signs use a rule of thumb. It is about twenty-five millimetres of capital-letter height for every three metres of viewing distance, for text you want read without effort. Written as a formula, with the conversion to pixels, it looks like this:
letter height (mm)  = viewing distance (m) x 8        (comfortable reading, rule of thumb)
pixels per mm       = screen width (px) / screen width (mm)
letter height (px)  = letter height (mm) x pixels per mm
font size (px)      = letter height (px) / 0.7         (capitals are about 70% of a font size)
Worked as an example only: a fifty-five-inch television is about 1,220 mm wide, so at 1,920 pixels across it has roughly 1.6 pixels per millimetre. A door three metres away needs 24 mm capitals, which is about 38 pixels of letter height. That means a font size near 55 pixels. On a screen with twice the pixels across, double it. That is bigger than you think. (No, bigger than that.)
Tiles over graphs
A tile is one rectangle, one colour, one name. That is the panel type a wall screen is made of, and the only one that works reliably from the door. The colour carries the state, the name says what the state belongs to, and there is nothing else to read.
A line graph fails at three metres for reasons you can check yourself. The line is a pixel or two wide. The axis labels are set in a font meant for a desk. Its meaning lives in the relationship between the line and the axis — is it above the threshold, and is it rising? That relationship is invisible from across the room. What the room sees is a squiggle.
The deeper problem is that a graph asks the room a question, and a tile answers one. A graph of traffic on the internet link says "here is the traffic; you decide". A tile says "Internet: fine". On a desk the question is welcome, because you are sitting there to think about it. On a wall nobody is there to think. Put the thinking into the tile's rule and show the room the answer.
A headline number is allowed when it is big and its meaning is plain without context. "Open incidents: 1" works. "Latency: 34 ms" does not, because the room does not know whether 34 is good. A number that needs a threshold beside it is a graph that has lost its axis. Graphs on a wall are not read. They are exhibited.
Size and contrast rules
Make each tile at least the size of a spread hand held against the wall. A twelve-tile grid on a normal television gives tiles roughly the size of a sheet of paper, which is comfortable. Sixteen is the upper limit before names shrink below the reading-distance test. Twenty is a mosaic.
Fill the whole tile with the state colour. Do not colour only a border, a dot, or an icon in the corner, because the tile's area is what the eye catches from the side. A green rectangle with a red dot in it is a green rectangle from the doorway.
Use dark text on light fills and light text on dark fills, and check it from the door rather than the keyboard. Pale, muted fills for the normal state and strong, saturated fills for problems give you contrast between states as well as within them. One red tile among eleven pale green ones is visible from the corridor. Twelve saturated green tiles make a glowing block that the eye stops seeing by lunchtime.
Give the same size to tiles of the same importance, and a bigger tile to anything the rest depend on. If the internet link and the core switch are what every other service needs, they can be double-width in the top row. Dependency thinking explains how to work out which services those are; the wall simply makes them larger.
What red is allowed to mean
Red means "someone must act now". Only that. Not "a threshold was crossed briefly", not "a job is running late", not "a printer wants toner". If red can mean several things, the room learns that red is optional. A room that has learned red is optional will walk past the real one.
The colour budget is four colours. And you do not get more: green for fine, amber for degraded or watch, red for act now, and grey for no data. Blue, purple, teal, and the rest mean nothing to a passer-by. A colour that means nothing is a colour the eye has to stop and decode. Severity design covers how to sort alerts into levels; the wall inherits those levels and paints them.
Amber must be temporary. A tile that has been amber for a month is not warning anyone; it is furniture. Give every amber tile a rule that clears it or promotes it to red within a known time. If an amber condition is genuinely permanent, fix the condition or drop the tile. The slow decay of a wall into permanent ambers has its own guide, dashboard wallpaper, and it always starts with the first amber nobody cleared.
Do not put a red tile on the wall for anything the room is not expected to fix. Not once. Not "so people are aware". Awareness is what the manager's page is for.
Refresh and the freshness marker
The refresh interval is how often the screen redraws itself from the monitoring data. And the polling interval is how often the monitoring system collects that data. The wall cannot know anything sooner than the poller does. So refreshing every ten seconds against data collected every two minutes achieves nothing but a flicker. Refresh every thirty to sixty seconds, and write the tile rules in terms of the polling behind them. The guide choosing polling intervals covers the collection side.
Put a freshness marker on the screen, in text large enough to pass the reading-distance test. The simplest is a clock in a corner that shows the time of the most recent data, not the current time. Those are different clocks, and the difference is the whole point. A clock showing the current time proves the television is on. A clock showing the last data time proves the monitoring is.
Then add the rule that makes the marker matter: a tile whose data is older than three polling intervals turns grey. Not green. Grey. A grey tile says "I do not know", which is honest. A wall of grey tiles is alarming in a way a wall of stale green tiles never will be.
Why go to this trouble? Because a wall showing the last known state looks identical to a wall showing the current state. The collector — the part of the monitoring system that actually fetches the measurements — can stop. In that case, every tile stays whatever colour it was last painted. Heartbeats and deadman checks explain how the monitoring system can watch itself. The grey rule is the wall's own version of the same idea.
At Meridian Parts the wall showed twelve green tiles for nine days after the collector service on the monitoring server stopped. That was because each tile was faithfully showing the last value it had received, and green is green. A file server went down on day four and was found by the accounts team, who mentioned it at lunch. The post-incident review described the nine days as "a gap in coverage". The wall now has a last-data clock and a grey rule after three missed polls, which was the cheapest change in the whole review.
What never goes on a wall
Some things do not belong on a wall no matter how much space is left. The space is usually why they end up there.
- Anything that needs a click. Nobody clicks a television. If a panel only makes sense once you hover, zoom, or expand it, it belongs on the admin's morning view.
- Anything with more than one number per tile. Two numbers mean the reader must decide which one matters, and the wall has already failed at that point.
- Anything private. Hostnames containing people's names, customer identifiers, ticket text. The wall is in a room that visitors walk through, and it is the screen most likely to be photographed for someone's slide deck.
- Anything that changes less than once a week. A licence count or a certificate's days-remaining will look the same for months and be ignored on the day it matters. Slow things belong on the manager's page.
- Anything nobody owns. If no named person reacts when the tile goes red, the tile is a prediction, not a control.
That last rule removes more panels than the other four put together. (It is also the one that starts arguments.)
The layout template
Here is the layout I start from. It has a status strip across the top and a four-by-three grid of service tiles. It has a narrow alert ticker down the right-hand side, and a freshness marker along the bottom. Twelve tiles is not a magic number; it is the most that pass the reading-distance test on a normal television, and fewer is fine. The template is plain text so you can paste it into a design note and rename the tiles.
+---------------------------------------------------------------+-------------+
| STATUS STRIP:  ALL CLEAR      Open incidents: 0    On call: -- | ALERTS      |
+---------------+---------------+---------------+---------------+ (newest     |
| INTERNET      | FIREWALL      | CORE SWITCH   | WI-FI         |  at top)    |
|   ok          |   ok          |   ok          |   ok          |             |
+---------------+---------------+---------------+---------------+ 14:02       |
| DNS           | DHCP          | EMAIL         | FILE SERVER   |  vpn down   |
|   ok          |   ok          |   ok          |   ok          | 13:40       |
+---------------+---------------+---------------+---------------+  backup     |
| PHONES        | VPN           | BACKUPS       | UPS / POWER   |  late       |
|   ok          |   ok          |   ok          |   ok          |             |
+---------------+---------------+---------------+---------------+-------------+
| LAST DATA: hh:mm:ss        grey tile = no data for 3 polls                  |
+-----------------------------------------------------------------------------+
Figure 1 shows the same layout drawn as a screen. The status strip is the one place a sentence is allowed: "ALL CLEAR" or "1 INCIDENT", in the largest text on the screen. So the room's first glance lands on a word. The ticker lists the last few alerts with their times, newest at the top. It answers the question a room asks right after "is something wrong", which is "since when".
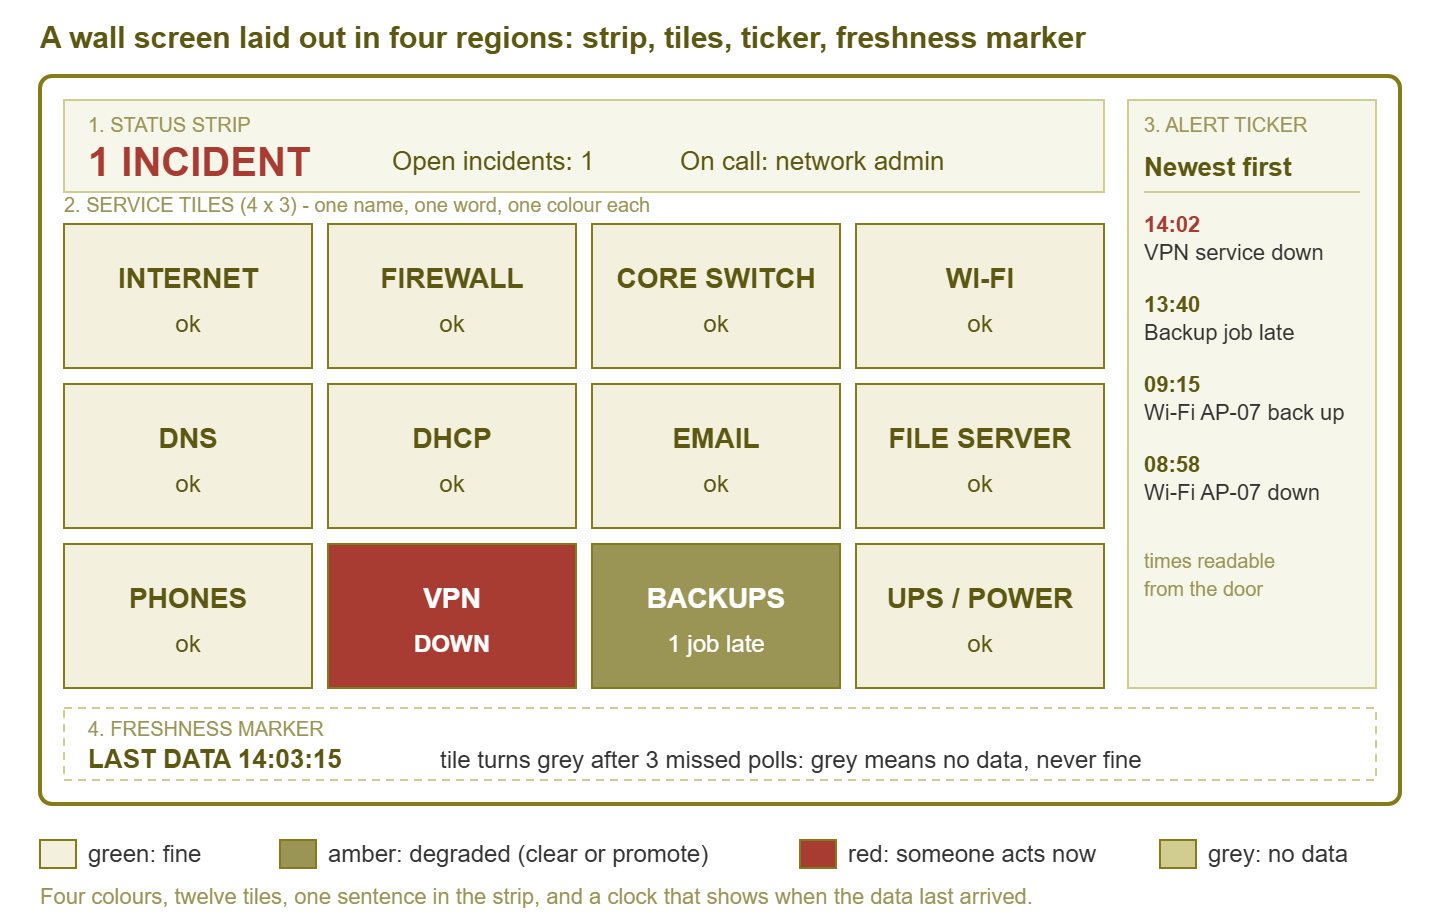
Figure 1: The wall layout. Four regions, four colours, one sentence, and a clock that shows when the data last arrived.
Every tile needs a specification written down, so the next admin knows exactly what the colour is claiming. The tile-spec table is that document. The source check is the monitoring check the tile reads. The rule says which results paint which colour; the owner is the named role that reacts to red. The thresholds are starting points, and yours will differ.
| Tile | Source check | Green / amber / red rule | Owner |
|---|---|---|---|
| Internet | Ping to two external targets, every minute | Green: both answer. Amber: one lost, or loss over 2% for 10 min. Red: both lost for 3 polls. | Network admin |
| Firewall | SNMP reachability and CPU | Green: reachable, CPU under 80%. Amber: CPU over 80% for 10 min. Red: unreachable for 2 polls. | Network admin |
| Core switch | SNMP reachability and uplink status | Green: reachable, uplinks up. Amber: uplink errors rising. Red: unreachable for 2 polls, or an uplink down. | Network admin |
| Wi-Fi | Access point reachability | Green: all APs up. Amber: one AP down. Red: two or more down, or the controller down. | Network admin |
| DNS | Real lookup against each resolver | Green: all answer under 500 ms. Amber: one slow or failing. Red: all failing for 2 polls. | Server admin |
| DHCP | Service state and scope usage | Green: running, scopes under 80%. Amber: any scope over 80%. Red: service down, or a scope over 95%. | Server admin |
| Mail service reachability and queue length | Green: reachable, queue normal. Amber: queue growing for 15 min. Red: down for 2 polls. | Server admin | |
| File server | Reachability and free disk | Green: up, disk under 85%. Amber: disk 85–95%. Red: down for 2 polls, or disk over 95%. | Server admin |
| Phones | Call manager reachability | Green: reachable, registrations normal. Amber: registrations dropped. Red: unreachable for 2 polls. | Network admin |
| VPN | Service reachability and tunnel state | Green: up, tunnels established. Amber: one tunnel down. Red: service down, or all tunnels down. | Network admin |
| Backups | Last job result and finish time | Green: all jobs succeeded. Amber: a job late or report missing. Red: a job failed. | Server admin |
| UPS / power | UPS status over SNMP | Green: on utility, battery healthy. Amber: runtime under 10 min. Red: on battery. | Facilities and IT |
Notice the pattern in the red column: every rule says "for N polls", never "once". A wall that turns red on a single missed ping turns red several times a day. And the room has stopped believing it by Thursday.
Tip: drive the wall from a small dedicated machine, not somebody's laptop, and turn off its screensaver, power saving, and update-and-reboot behaviour. The most common reason a wall shows nothing is a login prompt that appeared at three in the morning and has been waiting patiently ever since.
The wall screen checklist
Run this list before the screen goes up, and again at every review. "Mostly" counts as no.
- The audience is written down as "the room", not a named person.
- The status strip states the question: "is anything broken right now?"
- Every service name is readable from the door, tested with the lights on.
- Every panel is a tile; no line graphs, gauges, or tables.
- Each tile shows one name and at most one number.
- Only four colours are used: green, amber, red, grey.
- Every red rule requires more than one failed poll.
- Every amber has a rule that clears it or promotes it within a known time.
- The freshness marker shows the time of the latest data, readable from the door.
- Tiles turn grey after three missed polls.
- Nothing on the screen needs a click, hover, or scroll, and nothing is private.
- Every tile has a named owner in a tile-spec table stored with the monitoring documentation.
- The next review date is on the calendar.
Where to go next
The wall is the loudest dashboard in the building and the easiest to get wrong. That is because it is the only one you cannot test from your own chair. Build it, walk to the door, and be honest about what you can read. Then keep it honest with a grey rule, a named owner per tile, and a review date. A wall that passes will be boring for months at a time, and the boredom is the product.
The wall's opposite number is the screen a manager opens in a browser, where the reader cannot ask what anything means. The guide the boss's browser covers that one. Visual hierarchy covers position, size, and colour as a language for any screen. The design review checklist ties it all into a thirty-minute ritual. All of them live under Dashboard Design: The NOC Wall vs. the Boss's Browser.
Put this into practice with SysPeep Monitor
A wall screen is only as honest as the polling behind it. SysPeep Monitor collects device and service state over SNMP, WMI, and SSH from a central Windows service, with optional remote probes for other sites. It shows it on live dashboards in the same web console it uses for alert rules and maps. The free trial installs in an afternoon, which is about how long the twelve-tile wall above takes to build.
Download Free TrialLearn About SysPeep - All Rights Reserved.