
Probes, Pollers, and Collectors: The Distributed Pieces Explained
Open any monitoring tool's architecture page and you meet a diagram full of confidently labeled boxes: pollers, probes, collectors, receivers, workers, agents, gateways. If you run a single-site network, the diagram looks like overkill. If you have just inherited a branch office or a DMZ, it looks like a vocabulary test you did not study for. Either way, the names are doing the intimidating, not the ideas. Each box does one simple job, and the jobs are easy to understand one at a time.
Here is the secret about distributed monitoring: nobody designs it up front. Monitoring grows distributed one piece at a time, each piece added because a specific problem showed up. That could be a site too far away, a zone too locked down, or a data stream too heavy. Learn what each piece is for, and every vendor diagram becomes readable. Better, your own architecture becomes explainable, which is what you will need at budget time and at 3 AM alike.
This guide names the cast of characters in plain words and explains the three classic reasons remote probes exist. It shows how the pieces talk to each other through firewalls. And — just as important — it tells you honestly when you need none of this.
In this guide
- The cast of characters
- Why probes exist: three drivers
- How a probe talks to home
- Placing and sizing probes
- Collectors: doors for pushed data
- When not to distribute
- The quick-reference table
The cast of characters
The central server is the brain. It keeps the schedule (what to check, how often), stores every result in the database, evaluates thresholds, fires the alerts, and serves the web console you actually look at. Whatever else your architecture grows, there is one brain, and everything below reports to it.
Pollers are the askers. A poller (some tools say "worker") is the part that actually performs checks. It sends the pings, asks the SNMP questions, runs the WMI and SSH queries, and hands the answers to the brain. In a small installation the poller lives inside the central server and you never think about it as a separate thing. At larger scale, tools let polling scale out to additional workers — same job, more hands.
A remote probe is a small poller stationed somewhere else. It lives inside another network — a branch office, a DMZ, a partner site. It polls the devices around it exactly as the brain would and reports the results home over a single connection. Think of it as a foreign correspondent. It does its reporting locally and files the story back to headquarters, rather than headquarters trying to interview everyone abroad by long-distance call.
Collectors are the listeners. Not all monitoring data is fetched; some of it is sent. Devices push SNMP traps ("something just happened!"), servers push syslog messages, network gear exports flow records describing traffic. A collector (or "receiver") is the always-on doorway that catches this pushed data and feeds it to the brain. Where a poller asks questions, a collector waits by the mailbox.
Agents are on-target reporters. An agent is a small program installed on the monitored machine itself, watching from inside and reporting in. Agents solve reachability and depth problems the other pieces cannot, and bring lifecycle costs of their own — the full argument lives in the agents-versus-agentless guide.
A warning about the words themselves: vendors do not agree on them. One tool's "probe" is another's "satellite," "remote engine," "gateway," or "scout"; "poller," "worker," and "collector" swap meanings between products with cheerful abandon. Do not map by name — map by job. Ask of any box in any diagram: does it ask, listen, live on the target, or think? That question sorts every rebranded piece into one of the five roles above, and it works on every tool you will ever evaluate.
Put together, the architecture reads as one sentence: the brain schedules and stores; pollers ask on its behalf, near or far; collectors catch what devices volunteer; agents speak up from inside; and every piece delivers its findings to the same database, where thresholds and alerts do their work. If you want the underlying journey of a single check — question out, answer back, row stored, alert evaluated — how network monitoring works walks it end to end. Everything here is that same journey, with some legs of it happening farther from home.
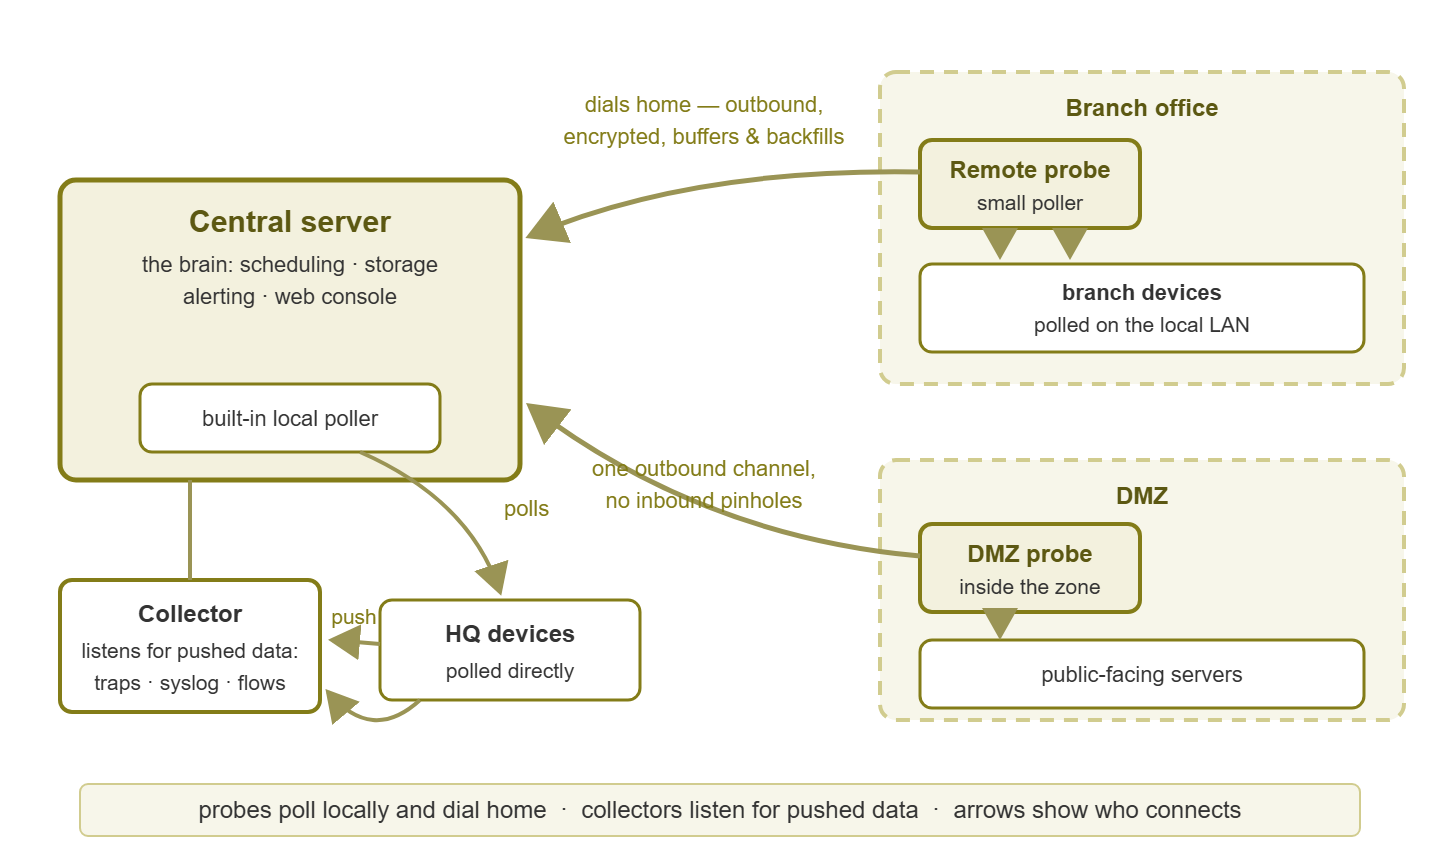
Figure 1: The cast in one picture. Probes poll their own neighborhoods and dial home; the collector listens for pushed data; the brain schedules, stores, and alerts.
Why probes exist: three drivers
Remote probes are the piece juniors meet first, because branch offices are where tidy single-site monitoring first breaks. Three classic drivers put a probe somewhere, and each has its own story.
Geography: the branch across a thin WAN
Polling a branch office from headquarters means every question and answer crosses the WAN link — the exact link that is slow, metered, or occasionally missing. Sixty devices polled every minute is a constant drone of management traffic on a wire you bought for business data. When the link hiccups, every branch device "goes down" at once as far as the brain can tell. A probe at the branch flips the economics: polling happens locally on the free, fast LAN, and only the results — compact and batchable — travel home. The thin link carries a trickle instead of a drone, and a wobbly WAN no longer masquerades as sixty device failures.
Topology: the zone you would rather not perforate
Some networks are hard to poll not because they are far away but because they are supposed to be hard to reach. Examples include the DMZ holding your public-facing servers, an isolated lab, and a partner enclave. Polling those from outside means punching a firewall pinhole per protocol per target — a wall of small standing holes through a boundary that exists to have none. A probe placed inside the zone inverts the arrangement: it polls its neighbors locally and maintains one authorized, authenticated channel out to the brain. One documented door instead of a colander. This is the same decision covered from the firewall's point of view in the management path guide. A probe is usually the cleanest answer once a zone holds more than a couple of targets.
Vantage: measuring from where users sit
A check's answer depends on where the question is asked from. From headquarters, the branch file service may look perfect — because the HQ-to-branch path is fine. From a desk at the branch, it may be miserable. A probe is a local witness: service checks it runs tell you what branch users actually experience, latency it measures is the latency they feel. When the branch manager says "everything is slow," a probe gives you their view of the world instead of yours — which is the view the complaint was filed from.
How a probe talks to home
The near-universal convention: the probe initiates the connection, outbound, to the central server. This direction is what makes probes firewall-friendly. The branch or DMZ needs no inbound holes at all — the probe dials out, the way any web browser does. And the only firewall work is one outbound allowance (and one inbound rule at the brain's side, from known probe addresses). Expect the channel to be authenticated — the server should accept reports only from probes it knows. Expect it to be encrypted, since check results and device names are exactly the reconnaissance an eavesdropper would order.
The second virtue of a good probe is memory. When the WAN link dies, the probe keeps polling its neighborhood and buffers the results; when the link returns, it backfills what it saw. That changes branch-outage forensics completely. Without a probe, an hour-long WAN outage is an hour-long blank in every branch graph — you will never know whether the site itself was healthy. With one, the graphs fill in after reconnect and answer the question that matters: was it just the link, or was the branch actually on fire behind it?
Be clear-eyed about the real-time side, though: while the link is down, buffered results cannot reach you, and neither can alerts about them. Your live signal during the outage is server-side — the brain noticing the probe has gone silent. Which is why that particular alert deserves special respect, as the next section insists.
It is also worth knowing what travels over that home channel, because it is less than people fear. Downstream, the probe receives its assignments — which devices to poll, how often, with which checks — so everything stays configured in one console rather than per site. Upstream flow is results: numbers, statuses, timestamps. In many tools the credentials for the zone's devices can live with the probe itself. In that arrangement, the secrets that unlock a DMZ never actually cross the DMZ boundary. It is a quietly excellent security property that a headquarters-polls-everything design cannot offer.
Placing and sizing probes
The default allocation is simple: one probe per site or isolated zone. More than that is rarely needed below serious scale; fewer means some zone is being polled the awkward way. As for what a probe needs, the honest answer is "not much" — but the little it needs, it really needs:
- Modest resources. Polling a site's worth of devices is light work; a small VM or a compact machine at the site is typically plenty. The probe is a correspondent, not a second brain.
- A reliable local position. On the site's server segment or management network, on protected power, on stable addressing — the same placement logic as the central server, scaled down. Not on a desktop that sleeps at night, which is a lesson everyone gets to learn exactly once, via a mysterious every-evening site outage.
- Time sync. The probe timestamps what it sees. And its clock must agree with the brain's, or backfilled data lands slightly out of joint and event timelines stop adding up across sites.
- A place in the update routine. Probes are software, and a fleet of them can drift out of step with the brain the same way agents do. Most tools keep probe upgrades painless — often pushed from the center — but "painless" still requires remembering they exist. Put them on the same maintenance calendar as the central server.
And monitor the probes themselves. A silent probe is not one gray icon — it is an entire site gone dark while every device behind it still shows its last-known state. The probe-down alert is Tier-1, wired to wake someone, treated with the same gravity as a core switch failure. The broader discipline — making sure the watchers are watched — is the whole subject of Monitoring the Monitor.
Tip: name probes and their checks after the site, bluntly: "Probe — Branch-North," not "probe02." During an incident, "Probe — Branch-North down" reads as what it is — a whole site offline. Nobody wastes five minutes translating an inventory code while the branch phones ring.
Collectors: doors for pushed data
Everything so far has been pull — the monitoring system asking. But devices also volunteer information on their own schedule, and somebody has to be home to receive it. That somebody is the collector: an always-on listener bound to a known address and port, catching three main streams. SNMP traps are a device's urgent interjections — "link down!", "power supply failed!" — sent the moment something happens, between anyone's polls. Syslog is the running diary: servers and network gear streaming their log lines to a central point. Flow records are traffic summaries — who talked to whom, how much — exported by routers and switches for bandwidth analysis.
Placement follows the same WAN economics as polling, with one difference: push streams can be heavy. Syslog and flow data from a busy site can dwarf polling traffic many times over. A central collector is the simple default for a single site. For remote sites, the probe usually plays local collector too — catching the site's traps and logs and forwarding what matters home. So the thin link once again carries a summary instead of a firehose. Whatever you deploy, the firewall work is the mirror image of polling: these channels flow from devices to the listener, and the rules must say so.
| Push channel | What arrives | Typical transport | Firewall direction |
|---|---|---|---|
| SNMP traps | Urgent device events | UDP port 162 | Devices → collector |
| Syslog | Streaming log lines | UDP port 514 (TCP and encrypted variants exist) | Devices → collector |
| Flow export | Traffic summaries | UDP, port set per device (a couple of conventional defaults exist) | Exporters → collector |
| Agent check-in | On-target reports | Outbound connection to the server's listener | Agents → brain |
One habit keeps collectors trustworthy. Since pushed data arrives only when something is sent, silence is ambiguous. A quiet trap channel might mean health, or a broken sending configuration. Send yourself a test trap or log line when you first wire a device up, and again after firmware changes. A door nobody has ever walked through might be a wall.
Tip: remember that the classic push channels ride on UDP, which is fire-and-forget by design. A trap or log line lost in transit is simply gone, with no retry and no receipt. That is fine for what push data is: a fast bonus signal between polls. It is why collectors complement polling rather than replace it — the poller's next question will still notice the down interface even if the trap announcing it went missing.
When not to distribute
Now the honesty section. If you run one site, with no DMZ to speak of and no branch offices, you need none of the distributed pieces. In that case, the brain with its built-in poller and listeners covers the whole estate from one machine. That architecture is not a starter home — it is the correct design for the size. Every piece you add is another thing to install, patch, secure, monitor, and explain to your successor. Complexity is a budget you spend; spend it on drivers you actually have.
The related anti-pattern deserves naming, because it is how multi-site monitoring usually goes wrong: the branch gets its own standalone monitoring tool instead of a probe. Now there are two consoles to check, two alert streams to tune, two databases to back up, and no single place where "is everything okay?" has an answer. A probe exists precisely to avoid that split — local polling, central brain, one console, one alert pipeline. If you find yourself installing a second complete monitoring system to solve a reachability problem, stop and check whether a probe was the actual answer.
The rule that keeps architectures clean: add a piece when its driver appears, not before. First branch office opens — that is the day a probe earns its place. Security team locks down the DMZ — probe. Syslog volume from a far site starts crowding the WAN — local collection. Polling load outgrows one machine's cycle — scaled-out polling. Each addition then has a reason you can say out loud, which is precisely what makes an architecture readable years later. The growth story — what outgrowing actually looks like and which piece answers which pain — is the subject of the Scaling Monitoring pillar.
The quick-reference table
| Piece | Its job, in one line | You need it when… |
|---|---|---|
| Central server (brain) | Schedules checks, stores results, evaluates alerts, serves the console | Always — there is exactly one |
| Poller / worker | Performs the checks and returns answers | Built in from day one; scales out only at serious check volume |
| Remote probe | Polls a distant or isolated zone locally, dials home, buffers through outages | A branch site, a DMZ, or a need for local vantage appears |
| Collector / receiver | Listens for traps, syslog, and flows | Devices have push data worth catching — usually early; local per site when volume says so |
| Agent | Reports from inside a target machine | Targets are unreachable from outside, or need inside-only depth |
Where to go next
Five pieces, five one-line jobs: the brain schedules and stores, pollers ask, probes ask from elsewhere and dial home, collectors listen, agents report from inside. That vocabulary is the whole trick. With it, vendor diagrams become readable and your own design becomes explainable. And "do we need a probe there?" becomes a question with a checkable answer: does one of the three drivers apply? Around this guide, the rest of the Monitoring Architecture pillar covers the decisions that come before the pieces. Those include where the brain itself should live and how the paths to devices are secured. They also include what database sits underneath it all.
Put this into practice with SysPeep Monitor
The architecture in this guide maps directly onto how SysPeep Monitor is built. One central service on a Windows machine does the scheduling, storage, alerting, and dashboards, polling over SNMP, WMI, and SSH. When a branch office or DMZ shows up, a lightweight remote probe covers that zone and reports home. Start the free trial with just the central service and add probes the day a driver appears.
Download Free TrialLearn About SysPeep - All Rights Reserved.