
A Monitoring Maturity Model for Small Teams: The Four Levels, Plainly
Sooner or later someone asks "how good is our monitoring?" and you discover you have no words for the answer. The alerts mostly work. The file server also went down last month, and the first you heard of it was a phone call from accounts. "Fine" is not an answer, "bad" is not fair, and "it depends" is true but does not help the person asking.
A maturity model gives you the words. It is a plain description of how a monitoring practice behaves at each stage of its growth. That lets you find the stage you are at and see the next one written down beside it. It is not a score, it is not an audit, and nobody needs a clipboard to run it. I have used it with a team of two and a team of twelve, and the conversation was the same at both sizes.
By the end of this guide you will be able to describe the four levels in plain words and recognise each one on an ordinary Tuesday. You will be able to score your team across six dimensions instead of with one number, and explain why almost every result is jagged. And you will be able to defend the idea that a level is a map, not a grade.
In this guide
- What a maturity model is, and what it is not
- Level 0: ad hoc
- Level 1: reactive
- Level 2: proactive
- Level 3: predictive
- The six dimensions
- Why a team is usually jagged
- A map, not a grade
- The level description table
- The four-levels checklist
- Where to go next
What a maturity model is, and what it is not
A maturity model is a set of descriptions, one per stage, of how a practice behaves. The value is not the label you end up with. The value is that the next stage is written down beside yours, so "get better at monitoring" turns into "do these three things". The model in this guide has four levels and six dimensions. And it is deliberately small. It is enough to separate a team that hears about outages from users from one that sees them coming on a graph. It is enough to notice that a team can be good at one thing and poor at another.
A maturity model is not a score to be ashamed of. A level describes what the practice does, not how hard the people work. A two-person team at level 1 is doing what two people can do. And the model's job is to show them the cheapest step to level 2, not to mark them down. I will say it again before the end.
A maturity model is not a sales tool either, although it is often dressed as one. When a vendor presents one, the top level tends to describe their product and the way to reach it tends to involve a purchase order. A model that describes practices rather than features scores the same team the same way whatever tool is in the rack. (The tool matters. It is just not a level.)
Level 0: ad hoc
At level 0 the users are the monitoring. Something breaks, a person notices, and they tell IT, who looks. There may be a tool installed. Someone set it up once, or it came with a device. The tool sends email to a mailbox that was last opened during an audit. Nobody could list what is monitored, because the honest answer is "whatever the last person thought of".
A Tuesday at level 0 goes like this. At nine the phone rings: the warehouse cannot print. Someone pings the print server, which answers, and then walks over. At eleven the same person is asked whether the VPN was slow yesterday and answers from memory, because there is no graph. At three a switch in the annex reboots and nobody knows until Thursday, when someone mentions that the Wi-Fi was odd. The team is not lazy. They simply find out about everything last.
Level 0 is where every practice starts, and where a practice drifts back to when the person who built it leaves. The first-thirty-days plan is the route out, and it takes about that long.
Level 1: reactive
At level 1 alerts exist and someone responds to them. The monitoring pings every server and switch anyone knows about, and a few important services have real checks. When a device stops answering, an email reaches a person who does something. That is a genuine achievement.
But most outages are still noticed first by a person. The mail server is pinged, so the monitoring is content while the mail service on it has hung. The alert for the disk that filled went to the same mailbox as four hundred alerts for the printer that goes offline every night. So the disk alert was not read. The team responds well; they just respond to what they are told, and they are told late and told too much.
A Tuesday at level 1: the alert mailbox holds ninety unread messages from overnight, of which one matters. Somebody skims them and finds it at ten. At two the finance system is slow. There is no alert because nothing is down. The graph shows a rising line nobody had a reason to look at until now. At five, the on-call person is whoever answers the phone. (There is no rota. There is a phone.)
Reactive is not a failure. It is where a working practice lives while it is being built. In this series, the guide on moving from reactive to proactive covers the handful of practices that move it on.
Level 2: proactive
At level 2 the monitoring finds most faults before a person does. The difference is not more checks; it is different checks. A service check exists for every service people rely on. This is a test that does what the user does, such as logging in or fetching a page. It does that rather than asking whether the box answers a ping. Dependencies — the recorded fact that the annex switch sits behind the core switch — mean one fault raises one alert instead of thirty. Baselines — a record of what normal looks like for each key metric — mean thresholds come from evidence rather than defaults.
The practices around the tool exist too. Every alert that fires more than once a month has a runbook, a short written procedure for what to do when it fires. Every incident gets a short review. Someone looks at the graphs every week on purpose. Capacity is planned: the team knows roughly when the file server will fill and has a purchase in the queue. Management gets a monthly page and, mostly, reads it.
A Tuesday at level 2: overnight there were three alerts, and each named a service and an action. The disk alert fired at eighty per cent with a runbook link, and the runbook was followed at nine. At three the annex switch reboots, and one alert fires. The dependency map explains the other twelve devices, and the runbook says "check the PoE injector first". It was the PoE injector.
Level 2 is where a small team should aim to live. A two-person team solidly at level 2 in the dimensions that matter to its business is doing well, and the next level is not compulsory.
Level 3: predictive
At level 3 the team can say what will break next quarter, and usually does something about it first. Predictive, in this model, means three plain things. Trends and capacity are reviewed on a calendar. Changes and failovers are rehearsed before they are needed. And next quarter's plan contains items that came from graphs. It does not mean machine learning or a feature you can buy. Whether a small team needs observability is a different question; predictive is about habits, not telemetry.
Take a Tuesday at level 3. The capacity register is a list of every finite resource with the date it is projected to run out. It has a row for backup storage that says "eleven weeks", and the purchase order was raised last month. The quarterly trend review found the database server's memory pressure creeping and moved a migration forward. A failover to the standby firewall was tested in the last maintenance window and found a stale route. The route was fixed then rather than at two in the morning. There was still an outage last month. It surprised nobody except the cable that caused it.
Level 3 is not the end of anything, only the level at which surprises are rarer and the work is calmer. The guide on moving from proactive to predictive describes its practices honestly, including which ones are marketing.
The six dimensions
One level for a whole practice hides more than it shows, so this model scores six dimensions separately. A dimension is one aspect of the practice that can sit at a different level from the others.
- Coverage. What is monitored, and how: ping or service check, whether dependencies are mapped, whether new systems are added at intake or discovered by their absence. Monitoring goals and scope is about deciding what belongs; this row is about whether it is there.
- Alerting. Whether alerts exist, reach a person, name an action, arrive without noise, and have thresholds that are reviewed. The anatomy of a good alert describes the level 2 alert.
- Response. Who responds, from what, and how it is recorded: runbooks, on-call, the incident clock, and reviews.
- Data and reporting. What history is kept, whether anyone looks at it on purpose, whether baselines and capacity figures exist, and what management sees.
- Process and rituals. The calendar. A ritual is a review that happens because it is scheduled rather than because something broke. This row counts which ones have a date and are kept.
- People and ownership. Who owns the monitoring, how many people can operate it, and whether it survives the owner's holiday. The monitoring bus factor pillar is entirely about this row.
Score each dimension from 0 to 3 using the table near the end of this guide, and write down the evidence beside each score. The evidence is the whole method, and the self-assessment guide gives it a worksheet.
Why a team is usually jagged
Almost every team scores differently across the six dimensions, and that is normal. A practice grows in the order its owner's pain arrived. The admin who was woken at three by an alert storm fixed alerting first, so alerting is at level 2 while coverage is still ping-only. The team that inherited a good tool from a good predecessor has level 2 coverage and level 0 ownership, because the predecessor was the ownership.
A jagged result is more useful than a flat one, because the lowest dimension usually limits the others. Level 2 alerting on top of level 0 coverage is a beautifully tuned alert about a ping. Level 3 data on top of level 1 process is a capacity register nobody opens. Find the lowest row first. The figure plots an example team; nothing about it is unusual, and nothing about it is a verdict.
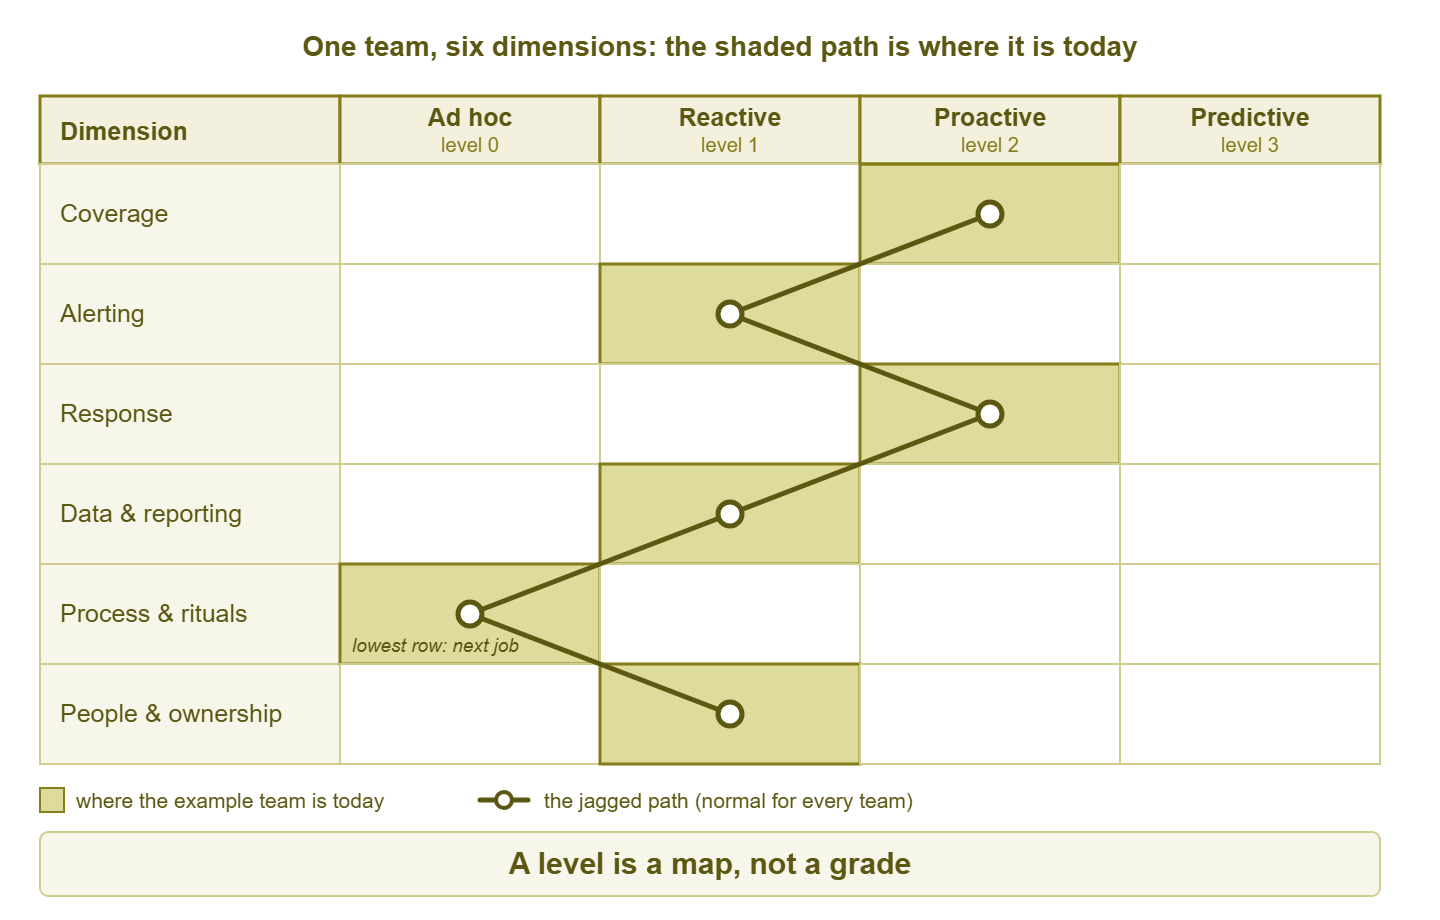
Figure 1: One team, six dimensions. The shaded path is jagged because practices grow in the order the pain arrived. And the lowest row is the one to work on next.
A map, not a grade
A level is a description of where you are, and a map is only useful if you are honest about that. The moment a level becomes a grade, people start scoring the team they wish they had. The level becomes something to be proud or ashamed of, and the map stops pointing anywhere. I have watched it happen. The manager said "we should really be at level 3", and every score in the room went up by one.
So say it more than once, and say it to yourself first. Take a two-person team at level 2 in coverage, alerting, and response. It has a level 1 in reporting because nobody has asked for a report. That team is doing well. The number is not a grade. It is a direction.
This model is not a health check either. A health check asks whether a practice shows the signs of working. This model asks what the practice does, in six areas, and shows the next step. The self-assessment guide spells out the difference and links the health check that pairs with it.
Meridian Parts described its monitoring as "predictive" in two consecutive budget documents. The basis was a tool whose box, brochure, and login page all used the word. A new operations manager asked to see the capacity register. The team produced a dashboard with a forecast line on it that nobody had opened since the demo. The file server filled the following month, on a Tuesday, and the first alert came from a user in accounts. The next budget document said "reactive, with a plan", which was accurate, and which was funded.
The level description table
This is the whole model in one table: six dimensions down the side, four levels across, one sentence per cell. Copy it into a document, read each row, and mark the highest cell that is true of your team this week, with something you could show. The cells are cumulative. A team at level 2 in a row also does everything in level 1 of that row. Otherwise, it is not at level 2 there. The table is written without jokes on purpose; it will end up in documents read by people who did not ask for any.
| Dimension | 0 — Ad hoc | 1 — Reactive | 2 — Proactive | 3 — Predictive |
|---|---|---|---|---|
| Coverage | A few devices are pinged when someone remembers; nobody can list what is monitored. | Every known server and switch is pinged, key services have real checks, and new systems are added when someone notices they are missing. | Every service users rely on has a check that does what the user does, dependencies are mapped, and new systems are added at intake. | Coverage is reviewed on a calendar against a written service list, and synthetic checks exist for the services users feel first. |
| Alerting | There are no alerts, or they go to a mailbox nobody reads. | Alerts reach a person who acts, but many are noise and thresholds are the defaults. | Every alert names a service and an action, one fault raises one alert, and thresholds are reviewed on a calendar against baselines. | Trend alerts warn of limits that will be crossed in weeks, and the alert list is pruned every quarter. |
| Response | Whoever is asked fixes it from memory, and nobody records what happened. | A named person responds in working hours, and the fix lives in that person's head. | Every alert that fires more than once a month has a runbook, incidents are timed, and a short review follows each one. | Failovers and restores are rehearsed on a schedule, and the response plan is tested before it is needed. |
| Data and reporting | Graphs exist only where the tool draws them by default, and nobody looks. | History is kept, and graphs are consulted during an incident to see what changed. | Baselines exist for the key metrics, someone looks at the graphs weekly, and a one-page report goes to management monthly. | A capacity register lists each finite resource with a projected date, and forecasts are reviewed every quarter. |
| Process and rituals | Nothing is scheduled; monitoring work happens when something breaks. | Monitoring is reviewed after a bad outage and then left alone until the next one. | Threshold review, coverage review, and post-incident review each have a calendar entry that is kept. | The quarterly plan contains items that came from graphs, and changes are rehearsed in a lab before production. |
| People and ownership | Nobody owns the monitoring; it belongs to whoever set it up, who may have left. | One named person owns the monitoring and is the only one who can operate it. | A second person can operate the monitoring, and the checks and alert rules are documented. | Ownership is written down, handovers are practised, and the monitoring survives the owner's holiday unnoticed. |
The coverage row is the one teams most often score too high, because "we monitor everything" usually means "we ping everything". A count of checks per device in the monitoring database separates the two. Names vary by product, so treat this as the shape and check the product documentation for yours:
SELECT device_name,
       COUNT(*) AS checks,
       SUM(CASE WHEN check_type = 'ping' THEN 1 ELSE 0 END) AS ping_checks
FROM checks
GROUP BY device_name
HAVING COUNT(*) = SUM(CASE WHEN check_type = 'ping' THEN 1 ELSE 0 END)
ORDER BY device_name;
Every device that comes back has nothing but a ping. If the list includes the mail server, the file server, and whatever the warehouse prints from, the coverage row is at level 1, whatever the dashboard says. That is the first line of the plan, not bad news.
Tip: score the six dimensions with one other person in the room, and let the more pessimistic one hold the pen. A score written by the optimist is a wish. A score written by the pessimist, with evidence, is a map.
The four-levels checklist
Use this the first time you place your team on the model and each time you revisit it. Each line is a yes or a no.
- You can describe each of the four levels in one plain sentence without using the word "maturity".
- You have read all six rows of the table, not only the ones you expected to do well in.
- Each dimension has a level written down, with evidence beside it that could be shown on a screen today.
- The lowest-scoring dimension is named as the one to work on first.
- No dimension was scored at a level because the tool has a feature for it.
- The result has been described, out loud, as a map and not a grade, to whoever will read it.
- A date is on the calendar to score again in six months.
Where to go next
Ad hoc is where users are the monitoring. Reactive is where alerts exist and people still hear first. Proactive is where the monitoring hears first, because the checks, dependencies, baselines, runbooks, and reviews exist. Predictive is where the calendar and the graphs tell you what next quarter holds, and you act on it. Every team is jagged across the six dimensions, the lowest row is the next job, and none of it is a grade. Three times now. I trust it has taken.
The next step is to score yourself with evidence, which Crawl, Walk, Run: Scoring Your Team Honestly walks through with a worksheet. Turning maturity into budget and credibility shows how to use the map where money is decided. All of them are part of A Monitoring Maturity Model for Small Teams.
Put this into practice with SysPeep Monitor
Most of the distance between reactive and proactive is service checks, dependencies, and thresholds set from history rather than defaults. SysPeep Monitor auto-discovers devices and interfaces and collects over SNMP, WMI, and SSH from a central Windows service. It lets you build dependencies, thresholds, and alert rules that keep one fault to one alert. The long-term graphs and reports are in the same web console. The free trial is a reasonable way to find out which row of the table your network is really on.
Download Free TrialLearn About SysPeep - All Rights Reserved.