
MSP-Style Monitoring Architectures in Plain Language
The day you become responsible for a second building, the monitoring documentation changes language on you. Yesterday it said "server" and "switch". Today it says probes, collectors, gateways, tenants, tunnels, and satellites, and the architecture diagram has more arrows than a subway map. It happens whether the second building is your own warehouse or your first paying client. I remember spending an afternoon on one such diagram and coming away with a headache and no plan.
Underneath the vocabulary there are only three shapes. They differ on four plain questions. Where does the watching software live? How does the data get back to you? What happens when the link goes down? And how many copies of everything are you willing to run? Answer those four and every diagram in every manual turns out to be one of the three shapes, drawn with a different set of icons.
This guide is the plain-language tour. By the end you will be able to name the three shapes. You will be able to explain how a remote site's data gets home through a firewall you do not control. You will also be able to describe what a probe does all day. And you will be able to choose a shape with a clear view of what it will cost you in effort. The "MSP-style" in the title is not a badge you need to earn. A managed service provider (MSP) is a company that runs IT for other companies. It simply meets these questions earlier and harder than an internal team does. An internal team with five branches has exactly the same problems, minus the invoices.
In this guide
- The problem every shape is solving
- Shape 1: one central platform, a probe at every site
- How remote data gets home
- What the probe does all day
- Shape 2: one platform per client
- Shape 3: one shared, multi-tenant platform
- Where the central platform lives
- The shapes side by side
- Choosing a shape, and mixing them
- Where to go next
The problem every shape is solving
Monitoring one building is simple. The monitoring server sits on the LAN and reaches every switch, server, and printer directly. It pings or asks a question over SNMP (Simple Network Management Protocol). SNMP is the standard way to ask network gear how it is doing. Or the monitoring server queries a Windows server over WMI (Windows Management Instrumentation, the Windows equivalent). The answer comes straight back.
A second building breaks that in four ways at once. First, the remote network is behind its own firewall and NAT (network address translation). NAT is the trick that lets a whole office share one public address. So your central server cannot simply reach in and poll a switch there. Second, even with the firewall opened, polling hundreds of checks across an internet link is slow and chatty. It exposes management protocols to the world, which every security person will happily explain is a bad idea. Third, the WAN link (wide area network — the connection between sites) is the thing most likely to fail. If all your visibility travels over it, a link failure makes the whole site vanish from your screen at once. Fourth, if the "site" is a client rather than your own branch, you also owe them a promise that their data stays theirs.
Every architecture here is a different answer to those four problems, and the vocabulary is small. The central platform is the server (or cluster of servers) that stores history, draws dashboards, evaluates alert rules, and sends notifications. A probe is a small piece of monitoring software placed inside a remote network. It does the local polling and sends results back to the platform. Some tools call it a collector, a satellite, or a remote agent, but the job is the same. A site is a physical location. A client is an organization you monitor on someone else's behalf. A tenant is a client as the platform sees it — a walled-off compartment of devices, users, and data. The general anatomy of probes and collectors is explained in Probes and Collectors; here we care only about how they fit into the shapes.
Shape 1: one central platform, a probe at every site
This is the workhorse. You run a single central platform. At every remote site or client you place one probe inside their network. It can be a small VM, a lightweight service on an existing server, or a tiny appliance. The probe polls everything locally, exactly as your monitoring server would if it were physically there, and sends the results home over one connection. The platform stores them, graphs them, alerts on them, and treats them exactly like data from its own local polling.
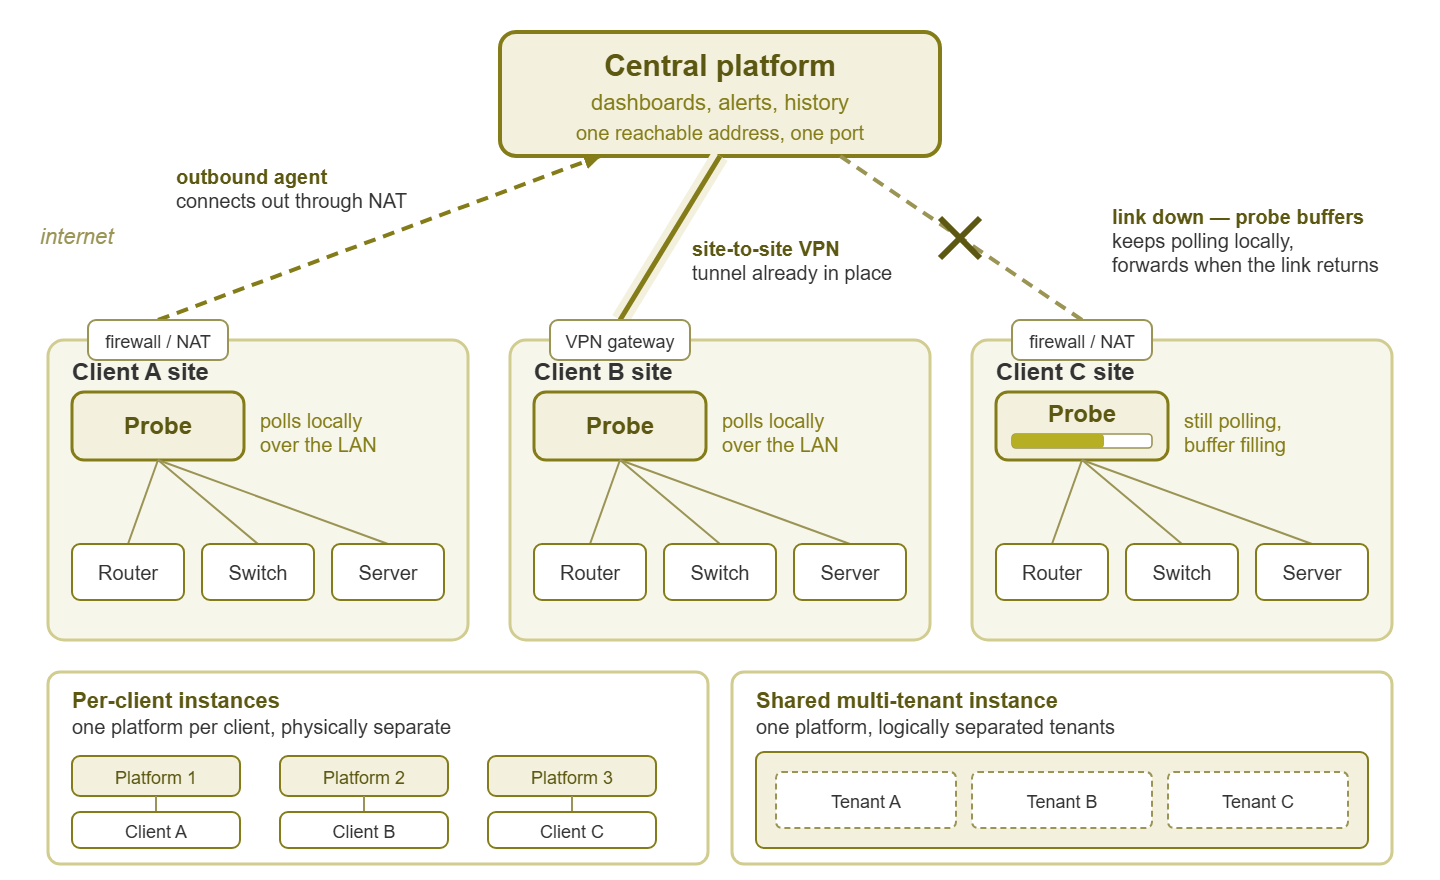
Figure 1: The central-platform-plus-probes shape. Each probe polls its own site locally and sends results home; when Client C's link drops, its probe keeps polling and buffers until the link returns. The inset shows the two tenancy choices layered on top.
The elegance of the shape is that the platform never needs to reach into a remote network. Only the probe needs to reach the platform, over one path to one destination. The probe also gives you eyes inside the site, seeing devices from the site's own point of view. That is what lets you tell "the WAN is slow" from "the server is slow." And when the link goes down, the probe keeps working.
The cost is that you now have a fleet of probes to look after. They are small servers at locations you rarely visit, running software that needs updating and holding credentials that need rotating. They sit behind firewalls somebody else manages. (Somebody who has never heard of your probe and would like to know why it is talking to the internet.) That is a real, ongoing job with its own guide: Managing a Fleet of Remote Probes.
How remote data gets home
The question everybody asks about Shape 1 is "but how does the data get through the firewall?" There are two honest answers.
Site-to-site VPN
A VPN (virtual private network) tunnel joins two networks across the internet so that, for routing purposes, they behave like one. If a site-to-site VPN already exists between your office and the remote site, the probe and the platform simply talk by private address. In that case, nothing else is needed. Such VPNs are common between branches of one company. The tunnel is encrypted and no inbound firewall hole is required beyond the VPN itself. There are drawbacks. A VPN is configuration you own and can break. A client rarely wants a permanent tunnel from their network into yours. And a tunnel tempts you to skip the probe and poll directly across it. That brings back every "chatty across the WAN" problem you were trying to avoid.
The outbound-only agent
This is the pattern behind nearly every MSP-style deployment. The probe opens the connection outward, to a published address of your platform, over a single encrypted port, and keeps it alive. Because the probe initiates, the client's firewall sees only an outbound connection from an inside machine to a known destination. That is the same category of traffic as a laptop reaching a website. NAT handles it with no inbound rule at all. The platform then talks to the probe over the connection the probe opened: "here is your configuration," "poll these devices," "send me your results." This is what people mean when they say the probe is the only thing that needs reachability. The probe must reach your platform. Your platform needs a reachable address. That is the whole list.
# What a client's firewall must allow for one probe (illustrative, in plain words)
FROM       the probe host on the client LAN     (e.g. 10.20.0.50)
TO         your platform's address              (one DNS name or one public IP)
PROTOCOL   TCP, one port                        (whatever your tool uses, normally TLS)
DIRECTION  outbound only                        (no inbound rule at the client site)
ALSO NEEDS DNS   to resolve the platform's name
           NTP   for time sync, or the client's own time server
           LAN   reachability to every device it polls (SNMP, WMI, ping, SSH)
Write that list down for every site. The day the client's IT person "tidies up" the firewall, this is the rule they will tidy. And note the last line. A VLAN is a virtual LAN — a segment the switch keeps walled off from the rest of the network. A probe stranded in a guest VLAN with no route to the server VLAN is a very quiet probe.
Which one?
For your own branches that already share a VPN, either works. For clients, the outbound agent wins almost every time. It means one firewall rule, no shared address space, no tunnel to maintain, and nothing that looks like a permanent door into their network. Either way, keep the probe; the transport is only how data travels.
What the probe does all day
Polling. The probe's main job is to ask local devices the questions the central platform would ask: pings, SNMP queries, WMI queries, service checks. Because these run over the site's LAN they are fast and cheap, and their timing is unaffected by WAN quality. A slow internet link does not make the site's switch look slow. Many probes can also run discovery of the local subnets, so a new device appears in your inventory without a visit.
Buffering. When the link home drops, a well-designed probe keeps polling and stores results in a local queue. When the link returns, it forwards the backlog, and your history shows what actually happened during the outage. The graphs have no gap. You can see whether the power stayed on, whether the server rebooted, or whether only the circuit failed. Two consequences follow. The probe host needs disk for the queue, and the queue has a limit. So find out how long yours can hold data before it starts discarding. Half a day is comfortable; an hour is not. I learned my own probe's limit the weekend a rural site lost its circuit on a Friday evening. The queue held ninety minutes, and Monday's graph had a very tidy gap.
Forwarding. The probe sends summarized results, not raw polls. A thousand SNMP answers become a compact batch of numbers, compressed and encrypted. That is why a probe's WAN footprint stays small even for a busy site.
What it usually does not do. Most designs evaluate alert rules centrally, so there is one set of rules and one place to answer "why did my phone buzz?" Some tools let the probe evaluate a few local rules while cut off, which is useful but adds a second place to look. The probe keeps no long-term history and has no dashboard of its own. Check your tool, but if you assume "probe polls, platform thinks," you will rarely be surprised.
Tip: the probe holds credentials — SNMP community strings, Windows service accounts, SSH keys — for everything it polls. That makes it a sensitive server sitting in someone else's building. Treat it like one: minimal services, patched, encrypted disk where practical, and a named owner.
Shape 2: one platform per client
In the per-client shape, every client gets a complete platform of their own: separate installation, database, logins, and alert rules. Usually, they still have probes at their sites if they have more than one site. The walls between clients are physical rather than logical. One client's dashboard cannot show another client's server, because the two never share a database, a web console, or a search box.
That total separation is why the shape exists. Some clients insist on it. Some regulated environments require that operational data not share storage with anyone else's. Some clients already own a platform and want you to run it; if you part ways, it stays with them. For those cases, per-client instances are not a compromise; they are the right answer.
The price is paid in effort, and it scales linearly with clients. Every task becomes N tasks: N upgrades, N backups to verify, N certificates to renew. You get N sets of alert rules that drift apart unless you enforce a standard by hand. You also get N logins for your technicians, with no cross-client overview unless you build one. A single sensible change — "warn at 85% disk everywhere" — becomes an afternoon of repeated clicking. The failure blast radius is how much goes dark when one thing breaks. It is small, which is genuinely attractive: one platform dies, one client is blind. But you will notice the effort long before you appreciate the blast radius.
Shape 3: one shared, multi-tenant platform
In the shared shape you run one platform, and every client is a tenant inside it. Their devices live in the same database and their probes report to the same address. But users, dashboards, reports, and notifications are scoped so each tenant sees only its own compartment. This is the shape most MSP-style tooling is designed around, and where the savings live. You get one upgrade, one backup, and one set of standards enforced once. You also get one login from which a technician sees every client. Cross-client overviews come free because the data is already in one place.
The trades are real. Separation is now a matter of configuration and discipline rather than physics. A device tagged with the wrong client is a leak. So is a report sent to the wrong address or a global map visible to a client login. The mechanics of scoping — tags, groups, roles, routing — are covered in Multi-Tenant Monitoring. The service promise you are making, and how to prove you keep it, is in Tenant Separation. The other trade is blast radius: a platform outage blinds every client at once, and a bad configuration change can touch every tenant. That is why the shared platform most deserves high availability: a second node that takes over when the first one fails. The shared platform also most deserves careful change control and its own monitoring.
Where the central platform lives
Whichever tenancy shape you pick, the central platform has to sit somewhere, and the choice matters, because everything you can see passes through it.
Your own office. Cheap, close, on your LAN, easy to back up. The catch is that your office is probably the least resilient building you monitor. A power cut or a broken internet link there blinds every client at the same moment — exactly when you are least able to do anything about it. If the platform lives there, it needs a UPS (an uninterruptible power supply). That is a battery that carries the rack through a power cut. A platform in your office also needs a second internet path and an honest answer to "what do we see if this building goes dark?"
Kestrel Managed Services found this out on a Saturday. Their platform lived in a rack in their own office. The landlord cut the building's power for four hours to test the distribution board. That had been announced in an email to a facilities mailbox nobody read. All fourteen clients went grey on a console nobody could open. During the same four hours one of those clients, Tollgate Foods, lost the core switch at its cold store. They rang the on-call phone to ask why the on-call phone had not rung them. The review described the two events as "concurrent". The platform now lives in a colocation rack, and the facilities mailbox has an owner.
A data center or colocation rack. A colocation rack is rack space you rent inside somebody else's data center. Resilient power and network, a real public address, no dependency on your office. The catch is that it is now another remote site you manage. It brings the same questions about remote hands, spares, and out-of-band access. That last one is a way in that does not depend on the network you are trying to fix.
A cloud VM. Reachable from everywhere, trivial to give a public address, and the natural fit for the outbound-agent pattern, since every probe connects to one well-known name. There are catches. You must secure it as an internet-facing host. A cloud region can have its own bad day. And outbound data may be metered by the provider.
Wherever it lives, the platform's own resilience is a first-class design item. Back up the configuration and database, and prove the backup by restoring it. Use high-availability clustering where the tool supports it, especially for the shared shape, so a node failure fails over rather than blinding everyone. Put something outside the platform that notices when it stops: an external check that expects a heartbeat and raises the alarm when it goes quiet. And monitor the platform's own CPU, memory, disk, and database growth. A monitoring server that fills its own disk fails in the least helpful way possible. The whole discipline lives in Monitoring the Monitor.
The shapes side by side
Shape 1 answers a different question from Shapes 2 and 3. "Central platform plus probes" is about how data gets home; "per-client versus shared" is about how many platforms you run. In practice you combine them. The classic MSP stack is Shape 1 for collection and Shape 3 for tenancy: one shared platform, one probe per client site.
| Question | Central platform + probes | Per-client instances | Shared multi-tenant instance |
|---|---|---|---|
| Separation between clients | Comes from the tenancy shape layered on top | Physical: separate installs and databases | Logical: scoped users, views, reports, routing |
| Cost of ownership in effort | One platform plus a probe fleet to maintain | Linear: every task repeated per client | Lowest per client once the standards exist |
| Failure blast radius | Probe down = one site blind; platform down = all blind | One platform down = one client blind | Platform down = every client blind |
| Upgrades and changes | Platform once; probes in waves | Repeated N times; versions drift | Once, but every change touches every tenant |
| Cross-client overview | Yes, if the tenancy shape allows | Only if you build it yourself | Built in |
| Offboarding a client | Remove the probe, revoke its credentials | Hand over or decommission the whole instance | Careful removal of a tenant from shared data |
| Best fit | Everyone with more than one site | Few large or regulated clients; client-owned platforms | Many clients, small team, consistent service |
Choosing a shape, and mixing them
The choice is rarely agonizing once the questions come in the right order.
- Do you have more than one site? Then you want Shape 1, full stop. Polling across the WAN from a single server is the mistake every multi-site team makes exactly once. If you are adding your second site right now, the scaling view covers what changes and what stays central. It also covers how to onboard a branch as a kit. That view is in From One Site to Many.
- Are the sites yours or someone else's? Your own branches need no tenancy at all. The first paying client is when the tenancy question arrives.
- Does any client require physical separation? If yes, that client gets a per-client instance. This does not commit you to per-client instances for everyone.
- How big is your team? Effort is the currency. A small team with many clients will drown in per-client instances and thrive on a shared platform with strong conventions.
- What is your tolerance for the platform going dark? The shared shape concentrates risk. If the answer is "none," plan clustering, tested backups, and an external heartbeat before the tenant count grows.
The common landing spot is a mix: a shared, clustered platform with a probe at every client site. That common mix also includes a small island of per-client instances for the one or two clients whose contracts or regulators demand it. Mixing is fine as long as you write down which client lives where and why. Six months from now a technician will ask, and "it seemed like a good idea at the time" is not an architecture document. And the shape is the easy part. The daily work is the probe fleet, the separation discipline, the rollups, and the reports — the other four guides in this pillar.
Where to go next
Every architecture diagram you meet from now on is one of three shapes wearing different icons. A central platform. Probes that poll locally and send results home over a VPN or an outbound connection. A choice between physical separation per client and logical separation inside one shared instance. Read the next subway map with the four questions in hand and the arrows sort themselves out, usually in less than an afternoon. The rest of Monitoring Across Multiple Sites and Clients builds on this. It covers rolling each site up into one honest status and keeping client A from ever seeing client B. It also covers running the probe fleet as a routine and reporting the service back to the people paying for it. The broader questions of growing a platform — performance, high availability, tenancy mechanics — live in Scaling Monitoring.
Put this into practice with SysPeep Monitor
If Shape 1 describes your situation, it is the shape SysPeep Monitor is built around. SysPeep Monitor has a central service on one Windows machine, with optional lightweight remote probes at other sites and segments. These feed dashboards, network maps, and reports in a single web console. High-availability clustering is there for the platform that must not go dark. The free trial installs on any Windows machine.
Download Free TrialLearn About SysPeep - All Rights Reserved.