
The Eight Places Your Monitoring Can't See
Your monitoring dashboard is green, and it is telling the truth. Every device on it is up. Every check is passing. What it is not telling you is that it only describes the devices you enrolled, and only answers the questions you asked. Consider the traffic that never crosses a monitored box, the gadget nobody added, and the segment you walled off on purpose. None of that is red, and none of it is green. It is simply not there, and a dashboard has no way to show you what it is not showing you.
Those gaps are called blind spots, and they are structural. They do not mean your tool is bad or that you set it up wrong. They are what standard monitoring is: a list of devices, asked questions on a schedule. Every network has them, including the ones run by teams with far bigger budgets than yours. What separates a well-run network from a fragile one is not zero blind spots, which is impossible. It is knowing where yours are. I have run a dashboard that was complete about the half of the network it knew about. It was a very reassuring dashboard right up until the afternoon it was not.
This guide is the map. It walks the eight places problems most often hide and explains why each one is invisible to a normal monitoring setup. It describes what tends to go wrong there. And it prices visibility at three levels of effort: a free habit, a modest configuration change, and a real investment. Several of the eight have their own deep-dive guides in this section. This is the tour that tells you which ones to read first.
In this guide
- Why every network has blind spots
- 1. East-west traffic 2. Encrypted payloads 3. Unmanaged devices
- 4. Guest and IoT segments 5. Remote sites and home offices
- 6. Cloud egress and SaaS 7. The management plane 8. Layer 1
- Ranking your own exposure
- Where to go next
Why every network has blind spots
A standard monitoring system is, at heart, a poller. It keeps a list of devices you enrolled and asks each one questions on a schedule. It can ask over SNMP (Simple Network Management Protocol, the standard way to ask network gear about itself). Or it can ask over WMI for Windows machines or through a small installed agent. It records the answers and alerts when an answer turns bad. This model is excellent, and it rests on three quiet assumptions. First, that the device is on the list. Second, that the poller can reach it. Third, that the problem you care about shows up in a number the device keeps about itself. Nobody writes those assumptions down, because nobody has to; the poller makes them on your behalf, every minute, without complaint.
Every blind spot in this guide is a place where one of those assumptions quietly fails. A gadget nobody enrolled breaks the first. An isolated segment or a distant home office breaks the second. And a whole class of problems breaks the third. Examples are traffic between two other machines, the content of an encrypted stream, and a fiber slowly dying in a cable tray. No polled counter describes those things — or none you were watching. None of this is your tool's fault, and none of it is yours. It is simply what polling is: a superb view of the devices you know about, and no view at all of anything else. For the bigger framework of vantage points and what each can see, read the network visibility mental model. This guide applies it to the eight gaps that show up on almost every real network.
Tip: build one reflex now and this whole subject gets easier. For every change you make, ask: if this went wrong, which graph would show it? If the honest answer is "none," you have just found a blind spot — for free, before it found you.
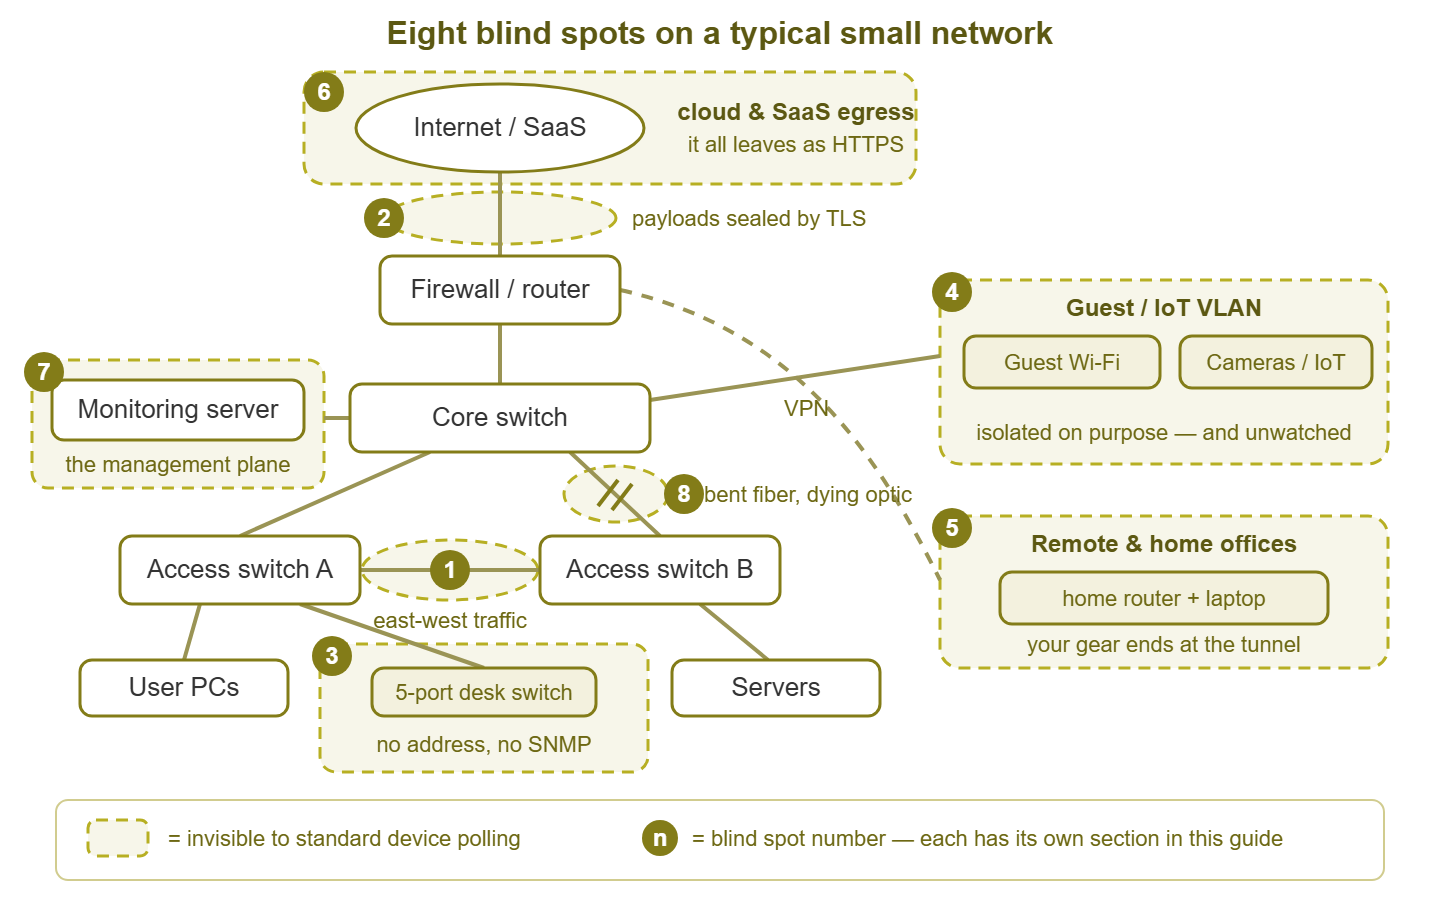
Figure 1: The eight blind spots on a typical small network. Shaded areas are invisible to standard device polling; the numbers match the sections below.
Blind spot 1: East-west traffic
Network diagrams traditionally draw the internet at the top. So traffic that flows up and down — between your network and the outside world — is called north-south. Traffic that flows sideways between devices inside is called east-west. Examples are a PC saving to the file server, one server replicating to another, or a backup job pouring data between racks. When two devices sit on the same switch and VLAN, their frames travel directly through that switch. Frames are the units of data a switch forwards. In this case, they never visit your firewall, your router, or anything else that logs or inspects traffic. The firewall only sees what crosses it, and most of what happens inside a network never does.
What hides there: a rescheduled backup job starts replicating server-to-server at half past nine in the morning. The file server turns to syrup. Tickets pour in. Every graph you own — internet link, firewall CPU, server pings — stays perfectly green. That is because the flood never touches any of the places you watch.
- Free habit: graph the traffic counters on the uplink ports between your switches and on key server ports. You will not see who is talking, but you will see how much and when — enough to spot that half-past-nine flood.
- Modest config: turn on flow export from your core switch if it supports it, so the switch summarizes every conversation for a collector. This is the sweet spot for east-west visibility.
- Real investment: port mirroring plus a capture machine for deep investigations, or a segmentation redesign that forces east-west traffic through a watchable boundary.
The full playbook — including what to look for once you can finally see — is in East-West Traffic: Watching What Never Crosses the Firewall.
Blind spot 2: Encrypted payloads
Nearly everything on a modern network travels inside TLS (Transport Layer Security, the encryption behind the browser padlock). That is excellent news for security. It means no box in the middle — including anything you monitor with — can read the content of those conversations. The encryption runs end to end between the two participants; everyone else sees sealed envelopes. Day to day this costs you little, because polling never read payloads anyway. It bites during investigations: the day you need to know what a device sent, the packets themselves will not say.
What hides there: a compromised workstation spends its nights uploading data to an outside server over HTTPS. By content it is invisible — just another encrypted stream on port 443, the port all secure web traffic uses, indistinguishable from a cloud backup. What gives it away is behavior: gigabytes flowing outbound at three in the morning from a machine whose owner is asleep.
- Free habit: turn on query logging on your internal DNS server. Devices ask it for names before almost every connection, so you learn who each device tried to find even when the conversations themselves are sealed.
- Modest config: baseline per-device traffic volume and timing, so the three-in-the-morning gigabyte stands out on its own with no decryption at all.
- Real investment: TLS inspection at the network edge — a middle-box your devices are configured to trust. Powerful, and expensive in performance, breakage, and policy questions; most small networks are better served by the first two moves.
What metadata reveals — and an honest treatment of the decryption question — is in What Encrypted Traffic Still Tells You.
Blind spot 3: Unmanaged devices
Every network accretes hardware nobody documents. There is the five-port switch under a desk quietly splitting one wall jack. There is the vendor's black-box "appliance" that came with the copier contract. There is the access point someone brought from home. And there is the single-board-computer science project cable-tied behind a monitor. Your monitoring polls a list, and none of these were ever on it. The cheap ones are worse than unlisted — an unmanaged switch has no management address and speaks no SNMP, so it is invisible by design. There is literally nothing to poll.
What hides there: a helpful employee plugs both ends of a desk switch into two wall jacks. They reason that two connections must be more reliable than one, a bet I have placed myself. That creates a loop. The loop creates a broadcast storm. The storm takes down the floor. And the hunt takes hours precisely because the culprit appears on no map you own.
- Free habit: read the MAC address tables on your managed switches. Several hardware addresses on a port meant for one device means something is multiplying it. And walk the building with open eyes now and then.
- Modest config: scheduled discovery sweeps of every subnet, diffed against your inventory, plus LLDP neighbor checks on switch ports.
- Real investment: port security or 802.1X, which stop un-enrolled devices from joining at all — effective, and a real administrative commitment.
The full hunt includes how to read a switch's address table and what LLDP will and will not tell you. LLDP is Link Layer Discovery Protocol, the standard by which managed network gear announces itself to its neighbors. That hunt, command by command, is in Finding the Unmanaged: Dumb Switches, Vendor Boxes, and Mystery Devices.
Blind spot 4: Guest and IoT segments
You isolated the guest Wi-Fi and the IoT gear on purpose. IoT means Internet of Things — cameras, sensors, door controllers, the suspiciously smart TV in the conference room. Usually, you put them on their own VLAN (virtual LAN). That is a separate logical network riding on the same physical switches. The isolation was the right call. But isolation cuts both ways: if the segment cannot reach your internal network, then your monitoring server usually cannot reach into the segment either. You built a wall for good reasons, and now you cannot see over it.
What hides there: a batch of security cameras on an isolated VLAN drops offline after a power blip. Nobody browses camera footage recreationally, so nobody notices — until an incident weeks later, when the recordings that matter turn out not to exist.
- Free habit: watch the segment from its edges — the firewall interface that serves it, its DHCP address pool usage, the access points broadcasting its network name.
- Modest config: open one deliberate, tightly scoped path from the monitoring server into the segment for polling. A pinhole, not a doorway.
- Real investment: a small monitoring probe that lives inside the segment and reports out through a single allowed path.
How to watch an isolated segment without breaking the isolation is exactly the subject of Monitoring the Networks You Deliberately Isolated.
Blind spot 5: Remote sites and home offices
The network now extends into kitchens and spare bedrooms, running on hardware you did not choose, over internet connections you cannot see. A VPN (virtual private network) tunnel connects each remote worker back to the concentrator at your end. That is the box that terminates every tunnel, and your visibility typically ends there. So when a remote employee says "the VPN is slow," the honest answer is that you have no idea. The problem could be their Wi-Fi, their ISP, the tunnel itself, or your side. And you hold exactly one data point, which is the complaint.
What hides there: an employee endures weeks of miserable video calls, blaming the VPN. IT restarts things ceremonially, twice. The actual culprit is a failing home router that drops packets every afternoon. It is discovered only when someone finally collects measurements from the far end instead of theorizing from the near one.
- Free habit: monitor your VPN concentrator's per-tunnel statistics, and write a short self-test users can run and paste results from when things feel slow.
- Modest config: reachability and latency checks toward each branch site's router, so site-versus-headquarters questions answer themselves.
- Real investment: a lightweight probe or agent at each site that runs checks locally and reports back to your central console.
Where the reasonable line sits between visibility and surveillance is covered in Extending Visibility to Home Offices (Without Creepware).
Blind spot 6: Cloud egress and SaaS traffic
Most of your users' work now happens in SaaS applications (software as a service). These apps run in a provider's cloud and reach your users through a browser. All of that work leaves your network through the same door: HTTPS to somewhere. On the WAN graph it is one fat, uniform stream of encrypted traffic. Which part is the accounting system, which is video calls, which is somebody's personal photo library syncing itself to eternity? The counter cannot say. And when a cloud app feels slow, you cannot immediately tell whose problem it is: yours, your ISP's, or the provider's.
What hides there: the internet link pins at 100% every morning and everything drags. The graph proves saturation but not the cause. It takes days to find the one machine whose file-sync client is re-uploading an entire archive on repeat. That is because outbound HTTPS all looks exactly the same.
- Free habit: run synthetic checks — reachability and response-time tests from inside your network to each critical cloud service. That way, "our link or their outage?" can be answered in seconds.
- Modest config: flow export at the internet edge, so outbound traffic can be attributed to the internal device producing it.
- Real investment: a filtering proxy or secure web gateway that logs egress by destination — along with the policy work that deploying one honestly requires.
Flow data is the workhorse for this blind spot; the Flow Monitoring guides cover it end to end. The synthetic check is the cheaper, humbler tool. Its real value is that it answers "our link or their outage?" in seconds, instead of in a meeting.
Blind spot 7: The management plane
The management plane is everything you use to run the network. That includes the monitoring server itself, SNMP access, SSH sessions and web consoles, and the network paths connecting them to your devices. It is infrastructure like everything else — and it is usually the least monitored infrastructure you own, because it is the part doing the monitoring. If the monitoring server dies on Friday night, who tells you? Silence from a monitoring system and genuinely good news are indistinguishable. The same goes for access paths. If the core switch's management address becomes unreachable, can you still get to its console? And would you find out before you needed to?
What hides there: a monitoring VM quietly fails to start after a Saturday host reboot. All weekend: no alerts, which feels like peace. Monday's outage then arrives with no history, no baselines, and no warning, and the after-action review contains the sentence "we assumed quiet meant fine."
- Free habit: use a daily heartbeat — an "I am alive" message from the monitoring machine. The absence of the message is the alarm. Also keep a written, tested list of every console access path.
- Modest config: a second, independent checker — any other box that pings the monitoring server and probes its web console, and complains loudly on failure.
- Real investment: true out-of-band access: a console server or a secondary path that still works when the network it manages does not.
Tip: whatever you build here, make missing news the alarm rather than relying on the system to report its own death. A monitoring system can only report problems it survives. The failures that kill it outright are exactly the ones a heartbeat checked by something else will catch.
Blind spot 8: Layer 1 — the physical world
Layer 1 is the physical layer: cables, connectors, optics, patch panels — the actual matter your network runs on. Polling cannot see matter. Consider a fiber bent past its tolerance in a cable tray or a patch cable pinched by a rack door. Or consider a transceiver slowly cooking in a hot closet. A transceiver is the plug-in module that turns electrical signals into light and back. None of these report anything, anywhere, until they corrupt enough frames to move an error counter. Even then, you only see it if you are watching error counters. Until that moment the port shows "up," the light on the switch blinks cheerfully, and the physical world is entirely dark to your tools.
What hides there: a rack door pinches a fiber during unrelated maintenance. For months afterward the office suffers on-and-off slowness that never quite lines up with load or time of day. The link stays "up" throughout. Someone finally graphs the interface error counters and sees a sawtooth of CRC errors (frames damaged in transit and silently discarded). They trace the cable by hand to the crimp.
- Free habit: graph error and discard counters on every uplink and server port. A healthy link's error count is essentially zero, so any steady growth is the physical world sending you a message.
- Modest config: alert on error-rate growth, and read optical power levels on fiber links where the optics support reporting them. A dying optic announces itself in falling light long before it fails.
- Real investment: a proper cable tester or certifier, labeled structured cabling, and spare optics and patch leads on the shelf so a suspect part can simply be swapped.
Ranking your exposure
Eight blind spots make a survey, not a to-do list. You cannot chase all of them at once, and you should not try. Instead, rank them: for each one, ask how much of your environment it describes and how badly a surprise there would hurt. Write the ranking down. On paper, not in your head, where everything ranks first. The table gives you the shortcuts.
| # | Blind spot | Bites hardest when… | Cheapest first move |
|---|---|---|---|
| 1 | East-west traffic | most of your traffic is internal: file servers, backups, imaging | Graph inter-switch uplink counters |
| 2 | Encrypted payloads | an investigation would need to know what left the network | Log DNS queries at your resolver |
| 3 | Unmanaged devices | the office invites desk switches; vendors install their own gear | Read switch MAC tables; walk the floor |
| 4 | Guest / IoT segments | cameras, controllers, or payment gear live on isolated VLANs | Watch the segment's DHCP pool and gateway |
| 5 | Remote sites | a meaningful share of staff works remotely | Monitor per-tunnel VPN statistics |
| 6 | Cloud egress / SaaS | the business runs on cloud applications | Synthetic checks to each critical service |
| 7 | Management plane | one monitoring box, and nothing watching it | A daily heartbeat whose absence alarms |
| 8 | Layer 1 | old cabling, crowded trays, no labels | Graph error counters on uplinks |
Meridian Parts had ninety-four devices enrolled in monitoring and a wall screen that had been green for most of a year. One Tuesday the goods-in floor lost the network for three hours while the wall stayed green. The wall stayed green because the floor's only enrolled device was the uplink port on the core switch, and the uplink was fine. The fault was a loop on a desk switch nobody had recorded, on a segment nobody polled, carrying a label printer nobody had thought to list. The incident review noted, correctly, that the monitoring had been "accurate throughout". It had been accurate about the server room, the core, and nothing past the patch panel. It took the outage to discover that the ninety-four devices were slightly under half of the network.
Nobody has zero blind spots. Not you, not the enterprise down the road with a full security operations team. Perfect visibility is not on the menu; the choices are knowing your dark corners or being surprised by them. Knowing is a finite, achievable project. Name each gap. Decide which ones you can live with and close the ones you cannot. Be honest in the incident review when one of them bites anyway. There is a worksheet for exactly this. The Blind-Spot Audit walks every class in this guide with a scoring sheet. That way, "we should look into that" becomes a ranked list with dates.
Where to go next
Start with the free-habit column. Every one of those moves costs an afternoon at most, and together they shrink all eight gaps. Then pick the two blind spots that ranked highest for your environment and read their deep dives. East-west traffic and unmanaged devices are the most common winners for small networks. The rest of the Network Blind Spots guides take each gap apart properly. The audit turns the whole subject into a checklist you can actually finish. The dashboard will still be green when you are done. The difference is that you will know what the green is about.
Put this into practice with SysPeep Monitor
Several of the eight are device-shaped problems, and discovery is the antidote. SysPeep Monitor auto-discovers the devices and interfaces on your network. Diffing a fresh scan against what you thought you had is a blind-spot audit all by itself. SysPeep Monitor's lightweight remote probes give distant sites and isolated segments a local set of eyes, all reporting to one console. The trial is free.
Download Free TrialLearn About SysPeep - All Rights Reserved.