
Extending Visibility to Home Offices (Without Creepware)
There was a time when "the network" meant the building. You could walk to every switch, and every complaint happened on infrastructure you owned. Now a large share of your workforce does the job from kitchen tables and spare bedrooms. They use networks you did not build, cannot log into, and will never see. When one of those people calls to say "everything is slow," you are being asked to troubleshoot a network you have never met. This is the modern blind spot, and it is enormous. I once spent a full afternoon diagnosing a VPN fault that turned out to be a microwave.
The tempting fix is to install something that watches the remote worker's machine and network very, very closely. Resist it. There are two different projects hiding inside "remote visibility". One is monitoring the work path, the connection between the company laptop and the company's services. The other is surveilling the household. The first is legitimate engineering. The second is creepware, and it costs you far more in trust than it returns in data.
This guide stays firmly on the legitimate side, and shows how much genuine diagnostic power lives there. It covers four layers of honest visibility, from your VPN edge down to the laptop's own view of its Wi-Fi. It also covers the diagnosis method that turns "it's slow" into "it's your Wi-Fi, your ISP, our VPN, or the app, and here is the evidence."
In this guide
- The bright line: work path, not household
- The path you are trying to see
- Layer 1: your side of the VPN
- Layer 2: what your apps feel like from a kitchen table
- Layer 3: the laptop's own report
- Layer 4: synthetic checks from the laptop
- Decoding "everything is slow"
- What not to collect, and how to roll this out
- A symptom-to-evidence decoder table
The bright line: work path, not household
Draw the line before you design anything, because every later decision hangs on it. On one side: the health of the work path. Is the VPN tunnel up and stable? Can the company laptop reach the company's applications, and how quickly? Is the laptop's own connection — its Wi-Fi link, its route out — good enough to carry work? Watching this is legitimate for the same reason watching your office switches is legitimate. It is the infrastructure the job runs on, and when it degrades, fixing it is your job.
On the other side: everything else that happens in that home. What the family browses in the evening, what devices are on the household network, when someone is or is not active outside the work systems. Collecting any of that is not monitoring; it is surveillance of a private home that happens to contain an employee. Beyond being wrong, it is also self-defeating. Trust is an operational asset. It is the reason people report problems early, run the updates you ask them to run, and plug in the equipment you ship them. A monitoring rollout that feels like spying poisons that asset in a week. You will spend years discovering the workarounds people invented to escape it. Creepy monitoring does not even produce good data: it produces people who use their personal laptop for anything they can.
So the rule for this whole guide: measure the path, never the household. Every technique below passes that test, and the "what not to collect" section makes the boundary explicit enough to put in a policy document.
The path you are trying to see
A remote worker's connection is a relay race with five runners, each owned by someone different. The company laptop (yours) connects over Wi-Fi to a home router (theirs). The router connects through a residential ISP (internet service provider; theirs, sort of). The ISP carries traffic to your VPN gateway or office edge (yours). That finally passes it to the applications (yours, or a cloud vendor's). A VPN — virtual private network — is the encrypted tunnel that makes the laptop behave as if it were plugged into the office. The concentrator or VPN gateway is the box at your edge where all those tunnels land.
Any runner can drop the baton, and from the user's chair every failure looks identical: "it's slow." Your visibility, though, is naturally split. You can watch your own segments directly. You can measure across the segments you do not own from the endpoints you do. And you must leave the rest of the household alone entirely. The map looks like this:
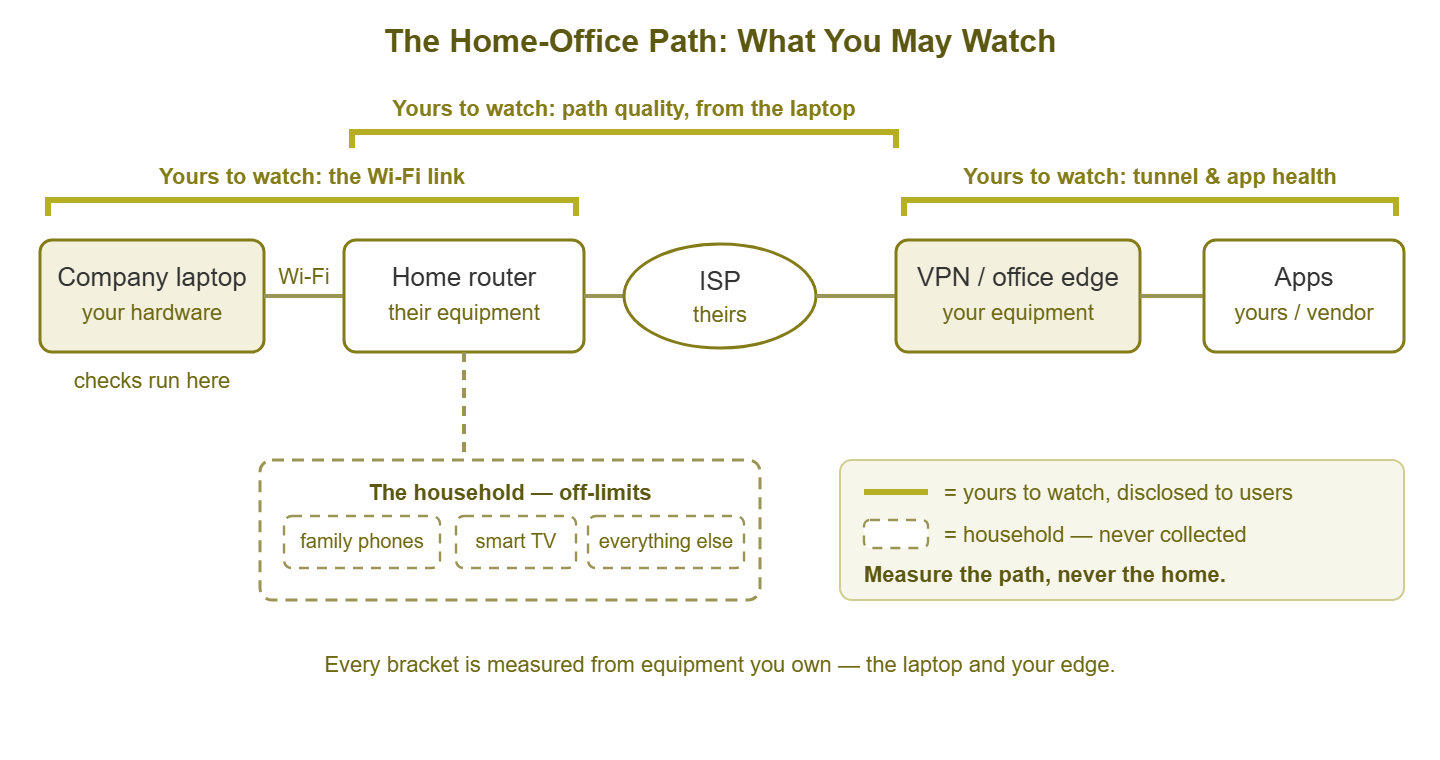
Figure 1: The home-office path. You watch your endpoints and measure across the middle; the household itself stays off-limits.
Four layers of measurement cover that map, moving from the easiest (entirely on your side) to the most delicate (running on the laptop, where transparency matters most).
Layer 1: your side of the VPN
Start at your own edge, because it requires nobody's cooperation and no software on any laptop. The VPN gateway already knows a great deal about every remote worker's connection. Most gateways expose it over SNMP, logs, or an API (a programmed query interface that another system can call). Three numbers matter per user.
Tunnel state — is this user connected right now? Simple, but it converts "I can't get on" calls from mysteries into lookups.
Connect/disconnect churn — how often does the tunnel drop and rebuild? This is the underrated one. A healthy tunnel connects in the morning and stays up. A tunnel that reconnects every twenty minutes is a fingerprint of an unstable connection underneath — flaky Wi-Fi, an overloaded router, a wobbly ISP link. Users rarely report it ("the VPN always does that"), so the churn log is often the only witness. A rising churn count is your earliest signal that someone's home setup is quietly degrading.
Ashgrove Housing had a tenancy officer whose video calls broke up every afternoon for six weeks. The VPN client was reinstalled, the laptop was reimaged, and the ISP was called twice, by the user, with nothing to show them. Somebody finally read the gateway's churn log. Her tunnel had been reconnecting roughly every eleven minutes between two and five, every weekday, for the whole six weeks. The laptop's own Wi-Fi numbers, once collected, showed the signal collapsing at the same times. The router sat on a kitchen windowsill, and the afternoon sun heated it until it rebooted. It was moved to a shelf. The reimaging had taken longer than the diagnosis, which took an hour once anyone was looking at the right end.
Per-tunnel throughput — how much data is each tunnel moving? This is not to judge anyone's productivity (do not go there), but for capacity and diagnosis. It shows whether the concentrator is near its limits. It also shows whether a "slow" user's tunnel is actually moving data or sitting stalled.
Then aggregate everything: total tunnels, total throughput, concentrator CPU and memory. The aggregate view is your single most powerful diagnostic, for a reason that appears again below. It instantly separates "one user has a problem" from "everyone has a problem." Those two sentences begin completely different afternoons.
Layer 2: what your apps feel like from a kitchen table
Users do not experience tunnels; they experience applications. The second layer watches the response times of the services remote workers actually touch: the web portal, the file service, the ticketing system, and the cloud suite. These are response times as seen by remote users, not just from inside the office where everything is one switch away.
You can get this per-user or per-population. Per-population is easy and honest. Run availability and response-time checks against each key service from somewhere other than the office network. That way, you see roughly what a remote worker sees. Per-user experience data may already exist in your app platforms — many web portals and cloud suites report page-load or session performance by user or location. Use what is already collected for operations before inventing new collection. "We looked at the portal's own performance dashboard" is both more useful and less invasive than anything installed in someone's house. The goal of this layer is one graph per critical app labeled "what remote users feel." That graph is where app-side slowness stops hiding behind "it must be the VPN."
Layer 3: the laptop's own report
The company laptop is your one legitimate observation point inside the home. It is your hardware, on the work path, sitting exactly where the user sits. A lightweight check that runs on it periodically can report the handful of numbers that diagnose most home-office misery:
- Wi-Fi link quality to their own router — signal strength and the loss/latency of the two-meter hop from laptop to home router. Weak signal here means the problem is between the desk and the router, and no ISP or VPN work will ever fix it.
- Packet loss and latency on the work path — small periodic probes from the laptop to your VPN edge, measuring what the whole household-to-office journey actually delivers.
- Basic machine health — CPU, memory, disk pressure, because "the network is slow" is sometimes an overloaded laptop.
Notice what this list measures: the work path and the work machine. The machine earns its place because "the network is slow" is sometimes forty browser tabs swapping a laptop to death. It does not read browsing, does not scan the home network for devices, does not track presence. Keep the checks lightweight and periodic — a probe every few minutes, a summary shipped to IT — not a continuous tap. Any endpoint tool you deploy will offer more collection than this; declining the extras is the discipline this article exists to encourage.
And run this layer in daylight. The users know the checks exist, what they collect, and why — written in plain language, not buried in an IT policy appendix. Ideally they can see their own numbers. That last part transforms the whole program. Suppose a user can open a page showing "your Wi-Fi signal is poor, your loss to the router is 8%." They stop being a monitoring subject and become a colleague with evidence. They can act on that evidence themselves, sometimes by moving the router off the floor behind the TV.
Tip: transparency is also the difference in how the data is received. "We noticed your connection degraded this week" lands as service when people knew the check existed, and as surveillance when they did not. Same data, opposite outcomes — disclosure is what flips it.
Layer 4: synthetic checks from the laptop
A synthetic check is a scheduled fake-user test. Instead of waiting for a human to try the app and fail, a script tries it on a timer and records the result. Layer 3 told you the path is healthy. Layer 4 tells you the services work from out there. The gap between those two is where the sneakiest remote problems live. A tunnel can be up and clean while the file service is unreachable through it. Even with an up, clean tunnel, name resolution can be broken for remote clients. Name resolution turns a server's name into an address. Or, with the tunnel still up and clean, the portal can work from the office but not through the VPN's routing. Users report this as "the VPN is broken" because from their chair the VPN is where work lives; the checks say otherwise. (This is the remote-work edition of a classic monitoring distinction — see Ping-Up vs. Service-Up.)
A small scheduled set covers it. Conceptually:
every 5 min:   ping the home router          — local Wi-Fi sanity
every 5 min:   ping vpn.company.example      — path to your edge
every 15 min:  resolve fileserver.internal   — DNS through the tunnel
every 15 min:  fetch portal.company.example  — does the app answer, how fast
Four checks, all aimed at work systems, all cheap. When a remote worker calls, you now hold a timeline. It shows exactly when the portal stopped answering from their laptop and whether the path underneath it was healthy at that moment. That timeline is the difference between troubleshooting and archaeology.
Decoding "everything is slow"
The call arrives: a remote worker, everything slow, meeting in ten minutes. There are four usual suspects, and the layers point at each one differently. Walk them in order. Do not restart the VPN first. Restarting the VPN first is how six weeks go by.
Suspect 1: their home Wi-Fi
Check the laptop's local numbers (layer 3). Weak signal or loss on the hop to their own router closes the case. In that case, the problem lives between the desk and the router. The fix is physical — move closer, move the router, use the cable that came in the box. This is the most common finding, and the evidence makes an awkward conversation easy. You are not guessing; you are reading their own laptop's measurements.
Suspect 2: their ISP
Local link clean, but the laptop's probes to your VPN edge show loss or heavy latency — and other users are fine. The trouble sits in the middle segment neither of you owns. You cannot fix a residential ISP, but you can hand the user a graph ("loss started at 2 PM, here is the pattern"). That turns their support call to the ISP from a shrug into a case. Home-office monitoring's most appreciated output is often this: evidence a user can borrow.
Suspect 3: your VPN edge
The aggregate view (layer 1) is the tell. One degraded user is their problem; many users degrading at once is yours. Suppose concentrator CPU is climbing, total throughput is flatlining at a ceiling, and churn is rising across the population. That pattern says the shared box is saturated or sick. In that case, no amount of individual troubleshooting will help until the shared thing is fixed. This is why the aggregate dashboard earns its place: it converts twenty identical tickets into one diagnosis.
Suspect 4: the app itself
Tunnels healthy, paths clean, and yet the synthetic checks (layer 4) show the portal slow — for remote users and from the office. The network is innocent; the application or its vendor is having a day. Escalate sideways with the response-time graph attached. Tell the remote workers the truth they rarely hear: it is not their Wi-Fi, and it is not the VPN.
What not to collect
Write the boundary down as policy, so it survives staff changes and vendor demos. A defensible baseline:
- No browsing or traffic content outside work systems. You measure whether the work path performs, not what else it carries or what anyone does off it.
- No inventory of the home network. Do not scan or enumerate household devices. The laptop may ping the router it uses; it does not go exploring past it.
- No activity-pattern surveillance. Connection health is not a timesheet. Do not repurpose tunnel or check data into "when does this person work" reporting — that is a different project, run by different rules.
- Nothing undisclosed. If you would be uncomfortable showing a user the full list of what is collected from their laptop, the list is wrong. Disclosure is the test.
Rules about workplace monitoring also vary by jurisdiction, so run the final policy past whoever handles legal and HR questions in your organization. The engineering position in this guide — work path only, fully disclosed — is deliberately conservative, which makes that conversation short. It also keeps you clear of the timesheet project, which is a different project, run by different rules, and probably a worse idea than it sounds.
A transparency-first rollout
How you introduce this determines whether it reads as help or as spyware. The sequence that works:
- Step 1: Announce before anything ships. Tell people what is coming, what it measures, and the problem it solves — faster fixes for remote connection issues, with evidence instead of guesswork.
- Step 2: Publish the exact list. One page: what is collected, how often, who sees it, how long it is kept, and — explicitly — the "what we do not collect" list from above.
- Step 3: Show people their own data. A self-service view of their own connection health, from day one if you can manage it.
- Step 4: Prove the value early. The first few times the data solves someone's problem in minutes, tell that story internally. "IT found my Wi-Fi issue before I finished describing it" is the reputation that makes the whole program welcome.
Tip: lead with the user's payoff, not yours. People accept "we can now see why your VPN keeps dropping and fix it" far more readily than "we are extending visibility." The first is a service with a beneficiary; the second is a euphemism with a subject.
The remote-complaint decoder table
Pin this next to the ticket queue. Each row is a symptom as users phrase it, the layer that usually explains it, and the evidence that confirms it.
| Symptom (as reported) | Likely layer | Confirming evidence |
|---|---|---|
| "Slow, and video calls break up" | Home Wi-Fi | Weak signal / loss on the laptop-to-router hop; path beyond router clean |
| "Fine all morning, awful since 2 PM" | Their ISP | Local link clean; loss and latency on the laptop-to-VPN path; other users unaffected |
| "VPN keeps kicking me off" | Home Wi-Fi or ISP | High connect/disconnect churn for this one tunnel over days |
| "Everyone on my team is slow" | Your VPN edge | Aggregate view: many tunnels degraded, concentrator CPU/throughput at ceiling |
| "VPN connects but the portal spins" | The app | Tunnel and path healthy; synthetic app checks slow from everywhere, office included |
| "Can't open anything by name" | DNS over the tunnel | Ping checks pass; name-resolution check fails from the laptop |
Where to go next
Home offices are the blind spot you fix with endpoints and honesty rather than switches and SNMP. But the method is the same one that works everywhere. Find the path. Instrument the parts you own. Measure across the parts you do not. For the full map of places monitoring goes blind, start with The Eight Places Your Monitoring Can't See. Browse the rest of Network Blind Spots for the corner-by-corner fixes. The evidence will sometimes say the problem is a kitchen appliance. Deliver that news kindly; I have been on the receiving end of it.
Put this into practice with SysPeep Monitor
The home end of the path is a policy conversation, but the office end is plain monitoring. That part SysPeep Monitor handles today. It watches your VPN gateway, firewall, and internet link over SNMP and WMI, and alerts when the shared side degrades. Its dashboards make 'one user or everyone?' a ten-second question. Lightweight remote probes can even watch from another site for an outside-the-office view. The free trial installs on any Windows machine.
Download Free TrialLearn About SysPeep - All Rights Reserved.