
Forensics, Auditors, and the Disk: Three Stakeholders in Every Retention Decision
Every monitoring system eventually asks you a question you were not expecting: how long should I keep this? It asks quietly, through a settings page you find months after the install. The default answer is whatever the vendor thought was reasonable for somebody else's network. The question is harder than it looks. The people who want your monitoring data want different things from it. None of them are in the room when you type the number.
There are three of them. The person doing forensics after an outage wants every raw sample from the last few weeks. The auditor wants proof, stretching back years, that a control existed and ran. The disk wants all of it gone, and it is the only one of the three who can enforce its opinion without asking. There is also a fourth, quieter voice, the capacity planner. This person needs a year of daily peaks and would like to be remembered when the rollups are chosen.
By the end of this guide you will be able to name what each stakeholder actually needs: for how long, at what resolution, and in what form. You will see exactly where those needs collide. And you will be able to settle the argument with a one-page retention matrix you can fill in for your own network. The rest of the Retention and Granularity pillar handles the arithmetic, the tiers, the housekeeping, and the archive. This guide handles the people.
In this guide
- Three words you need first
- The first stakeholder: the person doing forensics
- The second stakeholder: the auditor
- The third stakeholder: the disk
- The quiet fourth: the capacity planner
- What each one needs, side by side
- Where they conflict
- The negotiation: resolution decays with age
- The retention matrix template
- A war story from Meridian Parts
- Checklist and where to go next
Three words you need first
Retention is how long a piece of monitoring data stays in the database before it is deleted or summarised. Granularity, also called resolution, is how close together the measurements are: one every minute is fine-grained, one per day is coarse. A sample is one measurement of one thing at one moment, such as "at 09:05, the uplink on core-sw1.example.com carried 412 megabits per second." Everything in this pillar is a negotiation over those two numbers, retention and resolution, for every sample you collect.
A rollup is where the two numbers meet. It is one summary value that replaces many raw samples once they reach a certain age. Usually it is an average, ideally with the maximum and minimum alongside it. The guide on rollups and retention in the polling pillar explains the mechanism and what a rolled-up graph can and cannot show. So I will not repeat it. What matters here is that a rollup is a decision about who gets what. It was made by whoever last touched the retention settings, whether they knew it or not.
Status history is a separate stream from the numbers. Alongside the samples, your monitoring system records state changes. A device went down at 02:14 and came back at 02:31. A service check failed and then passed. Those rows are tiny, rare, and unusually valuable, which is a combination nothing else in the database can claim. Keep that in mind, because two of the stakeholders are going to ask for them.
The first stakeholder: the person doing forensics
Forensics, in monitoring, means working out what happened after it has finished happening. Something broke at four in the morning; by the time anyone looked, it had stopped breaking. The investigator, usually you, usually the next day, has to rebuild the sequence. That means finding which counter moved first and which device stopped answering. It means finding whether the CPU spike came before the latency spike or after it. The guide on incident timeline reconstruction shows how that rebuild works. This article is about making sure the data is still there when you try.
The investigator wants raw samples. Raw means every sample as it was collected, at the polling interval, with nothing averaged away. A five-minute outage on a link is a single tall spike in one-minute samples, a small bump in hourly ones, and nothing at all in daily ones. Investigators are not fussy about most of the data. They are fussy about the fifteen minutes that mattered, and they cannot tell you in advance which fifteen minutes those will be.
The forensic window is short: weeks, not years. The question to ask is: how long after something happens might someone need to look at it in detail? Add up the time for a user to mention that Tuesday was slow, and for the ticket to reach you. Then add the time for you to reach the ticket. For most shops that lands between two and six weeks. Beyond that, the investigator has moved on and the raw rows are mostly keeping the disk company.
The investigator also wants status history kept whole. The down and up events are the skeleton of every timeline. They cost almost nothing to store. And there is no sensible way to roll them up. A "daily average of being down" is not a number anybody has wanted.
The second stakeholder: the auditor
An auditor is someone whose job is to check that you did what you said you would do. Internal audit, an external certification body, an insurer, a customer's security questionnaire: the badge differs, the question is the same. In monitoring terms, the auditor wants proof that a control existed and ran. A control is something you do on purpose to reduce a risk. And "we monitor every server's disk space and alert at 90 percent" is a control. The auditor does not care that fs01.example.com hit 91 percent on a Wednesday. They care that you were watching, that the alert fired, and that you can show both. The guide on what auditors want goes through their side of the table.
The auditor wants long retention at low resolution. Their period is set by whatever framework or contract you answer to, and it is often a year or more. Their resolution is coarse: a monthly summary that says "monitoring covered these fifty devices, checks ran every five minutes, availability was this, alerts were raised on these dates." Daily rows will do. Raw samples are of no interest to them, which is a relief, because raw samples are the expensive part.
The auditor also wants integrity, which means evidence that the data has not been edited since it was recorded. For monitoring data, in practice, that means summaries produced by the system at the time. They must be stored somewhere other than the live database, with a date and a checksum. That is a job for the archive, covered in archiving old monitoring data. And the evidence packs guide shows how those summaries get bundled for the auditor's visit.
If your audits are about logs, meaning who logged in and what they changed, that is a different stream with its own rules. Those rules are covered in log retention for compliance. Monitoring metrics prove the watching happened; they do not prove who did what. Auditors are patient people, and they will happily wait eighteen months before asking you about a Tuesday.
The third stakeholder: the disk
The disk wants everything gone. It has no framework, no ticket, no incident, and it does not attend meetings. It has a capacity. When the data reaches that capacity the disk does not negotiate. It stops accepting writes, and the monitoring system stops recording the thing you were about to need. Of the three stakeholders, the disk is the only one who can end the conversation on its own.
The disk's need is easy to state and easy to forget. Daily growth must stay smaller than free space divided by the number of days before somebody notices. That is the whole requirement. The arithmetic to check it lives in storage math for monitoring data. The practical business of purging, compacting, and alarming on free space lives in monitoring database housekeeping.
The disk has a quiet ally in the database engine. A table that has grown to hundreds of millions of rows serves graphs slowly, and a slow graph is a graph nobody opens. The disk has never once been surprised to fill up. Everyone else in the building was.
The quiet fourth: the capacity planner
The capacity planner is the person who decides when to buy the next disk shelf, the bigger internet link, or the extra switch. It may be you, on a Friday afternoon, with a quote open in another window. The planner needs one thing the other three never ask for: a long, honest record of the peaks. Not the averages. A link that averages 30 percent busy but hits 95 percent every weekday at 09:00 is a link that needs upgrading. The average will never say so.
The planner's need is a year, ideally two, of daily maximums. One row per counter per day, holding the highest value seen that day, with the average alongside for context. At that resolution a year of one counter is 365 rows, which is nothing. The value is in the shape of the year: the slow climb, the seasonal hump, the step change the month the new office opened. The Trend Analysis and Degradation Creep pillar is entirely about reading that shape, and it cannot be read from data that was thrown away.
The planner is quiet because they ask only once or twice a year, and their need is cheap to meet. They are also the stakeholder most often forgotten. Whoever set the rollup to "average only" was not thinking about them. And by the time the planner asks, the peaks have been averaged into the floor.
What each one needs, side by side
Put the four needs next to each other and the pattern is visible: each stakeholder cares about a different age of data, at a different resolution. That is the whole reason a settlement is possible. The values in the table are typical starting points, not rules.
| Stakeholder | Wants | For how long | At what resolution | In what form |
|---|---|---|---|---|
| Forensics | Every sample, plus status history | Weeks (two to six is typical) | Raw, at the polling interval | Live in the database, graphable |
| Auditor | Proof the control existed and ran | Years (set by the framework or contract) | Monthly summary; daily at most | Exported, dated, checksummed |
| Capacity planner | Daily peaks per counter | One to two years | Daily maximum and average | Live in the database, graphable |
| The disk | Less of everything | Always | Any | Deleted |
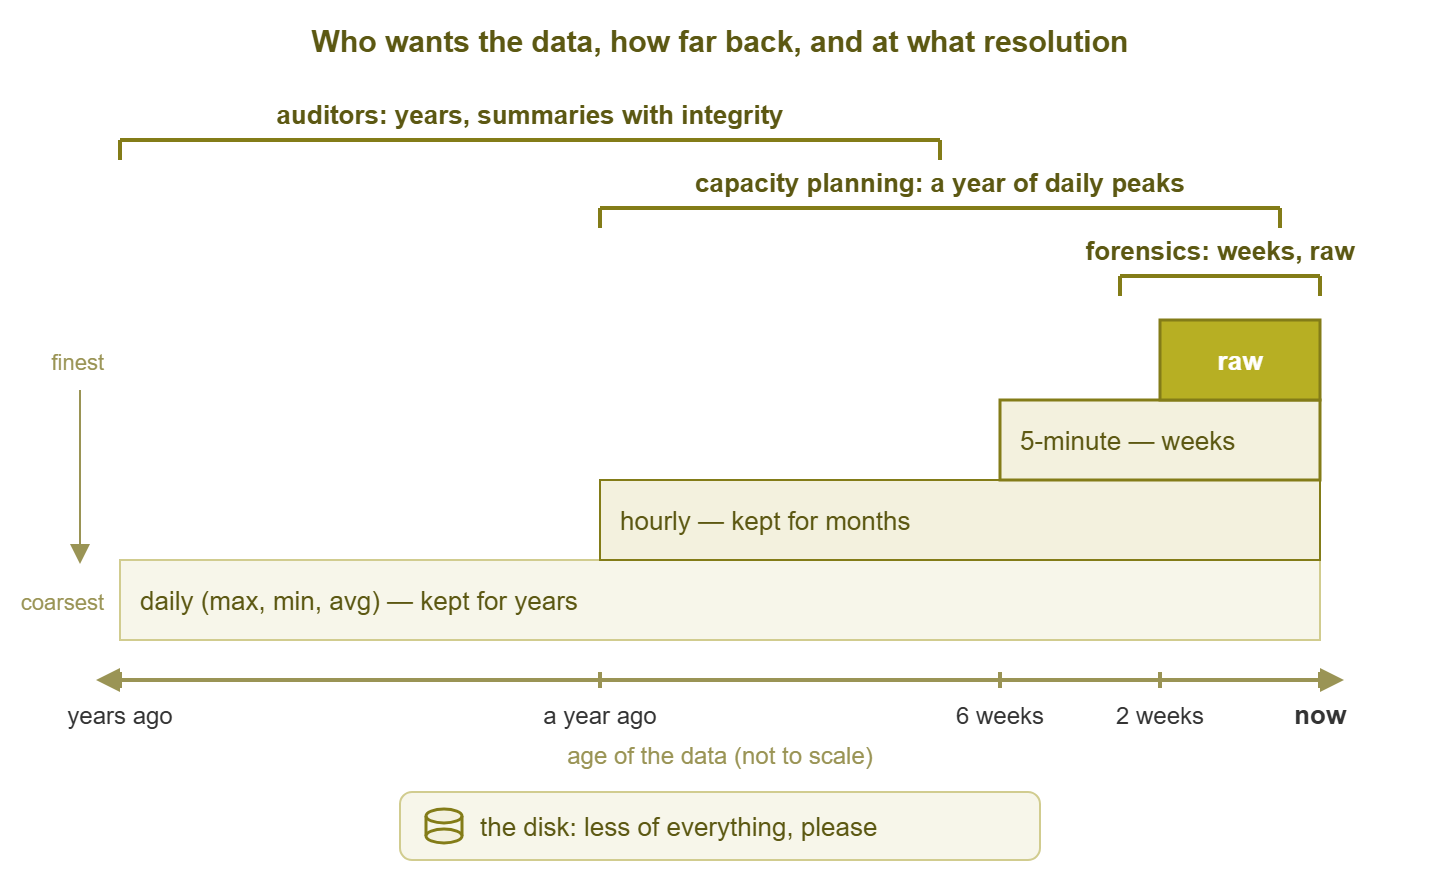
Figure 1: Each stakeholder wants a different age of data at a different resolution. Resolution decays with age so that all of them can be satisfied at once. The disk gets a growth curve that flattens instead of climbing forever.
Where they conflict
The conflict is not over the total amount of data; it is over two boundaries. Forensics wants the recent past in full detail, the auditor wants the distant past in summary, and the disk wants both smaller. Those three can coexist, because they are talking about different ages. The collision happens at the edges: the day raw becomes hourly, and the day daily becomes nothing.
The first boundary, raw to hourly, is forensics against the disk, and it is the expensive one. Every extra week of raw retention costs the raw daily growth of the whole estate, seven times over. This is the boundary to argue about, and the one to size with real arithmetic rather than a feeling.
The second boundary, daily to gone, is the auditor and the planner against the disk, and it is a cheap fight. A year of daily rows for one counter is 365 rows. At a sample every five minutes, raw data produces 288 rows per counter per day. So a whole year of daily rows costs about the same as a day and a quarter of raw. Give ground to the humans here. Two years of daily data is a rounding error next to two weeks of raw.
The third conflict hides inside the rollup itself: what survives when raw becomes hourly. An average-only rollup satisfies the disk and betrays the planner, because the peak is gone forever. Keeping the maximum and minimum alongside the average makes each summary row wider, still trivially cheap, and keeps the planner in the conversation. Designing retention tiers covers exactly which fields to keep and why.
The negotiation: resolution decays with age
The settlement almost every shop reaches has the same shape: resolution decays with age. Raw for weeks, hourly for months, daily for years, then gone. Each stakeholder gets the age range they care about at the resolution they need. And the disk gets a growth curve that flattens instead of climbing forever. It is the bargain a filing cabinet makes: this year's receipts in the top drawer, last year's in a folder, older years as one sheet of totals.
Two kinds of data are exempt from the decay and kept whole. The first is the incident snapshot: the raw window around an outage, exported on the day it happened, before the rollup reaches it. The second is the monthly summary. This is a small report produced at month end with availability per service, peaks per link, and alert counts. It is stored outside the live database. Both belong in the archive rather than the database, which is why the archiving guide treats them as its main cargo.
Write the settlement down. A retention policy is the document, and the metric retention policy guide gives a starter policy with sensible defaults for a small shop. The matrix below is the part of that document that records who asked for what and why. That is the part that gets lost first and argued about most. (Ask the stakeholders twice. The first answer is usually "just keep everything".)
The retention matrix template
The matrix has one row per data type and one column per tier, plus two columns that most policies forget: who asked for this, and why. The numbers below are example starting values for a shop that polls every five minutes; replace them with the answers from your own negotiation. Data types with "whole" in the raw column are never rolled up.
| Data type | Raw kept for | Hourly for | Daily for | Monthly for | Who asked | Why |
|---|---|---|---|---|---|---|
| Interface traffic (bits per second) | 4 weeks | 6 months | 2 years | Archive, indefinitely | Forensics, planner | Timelines; link upgrade timing |
| Interface errors and discards | 4 weeks | 6 months | 2 years | None | Forensics | Cable and optic faults |
| CPU and memory (servers, network gear) | 4 weeks | 6 months | 2 years | Archive, indefinitely | Forensics, planner | Timelines; server sizing |
| Disk space used | 2 weeks | 3 months | 2 years | Archive, indefinitely | Planner | Storage purchase timing |
| Latency and response time | 4 weeks | 6 months | 1 year | None | Forensics | "It was slow on Tuesday" tickets |
| Temperature, UPS, power | 2 weeks | 3 months | 2 years | None | Forensics | Cooling and power failures |
| Up/down status changes | Whole, 2 years | Not rolled up | Not rolled up | Archive, indefinitely | Forensics, auditor | Timelines; availability proof |
| Alert history | Whole, 2 years | Not rolled up | Not rolled up | Archive, indefinitely | Auditor | Proof the control fired |
| Incident snapshots | Whole, archived on the day | Not rolled up | Not rolled up | Archive, indefinitely | Forensics, auditor | Evidence at full resolution |
| Monthly summary reports | Not applicable | Not applicable | Not applicable | Archive, indefinitely | Auditor, planner | Control evidence; year-on-year trend |
Filling the matrix is a short procedure. It is worth doing as one rather than as a settings-page afternoon. The settings page will not remember why you chose the numbers.
- List every data type your monitoring system stores. The retention settings page or the database tables will tell you, and there are usually fewer than a dozen.
- For each stakeholder, ask (or role-play) the two questions: how far back, and at what resolution. Fill the "who asked" and "why" columns before touching the numbers.
- Fill each tier column with the longest period any stakeholder needs at that resolution. Forensics sets the raw column, the planner the daily column, the auditor the monthly column.
- Run the storage arithmetic and check it against the disk you actually have. If it does not fit, shorten the raw column first; it is the only one that costs real space.
- Translate the matrix into your product's tier settings, and record the date and the version you applied.
- Put a review date in the calendar, a year out, with the matrix attached.
Tip: the "why" column earns its keep the day someone asks to cut retention to save space. "Because the planner needs two years of daily peaks for the link upgrade case" is a conversation. "Because it was set that way" is a surrender.
A war story from Meridian Parts
Meridian Parts ran a warehouse picking system that went slow for about forty minutes one Thursday evening. That was long enough for the night shift to fall behind. And it was short enough that the system had recovered before anyone from IT looked. The retention settings had never been changed from the defaults: raw samples for seven days, hourly rollups after that. The investigation was scheduled for the following Friday, eight days later. That was when the warehouse manager and the network administrator were both free. On the Thursday night in between, the rollup job did its work, and the forty-minute event became a single hourly average about four percent above normal. The review concluded that "something happened on the database server or possibly the switch," and recommended more monitoring. They already had the monitoring; what they did not have was the week.
Checklist
- You can name the four stakeholders for your monitoring data and say, for each, how far back and at what resolution.
- The forensic window (raw retention) is set from how long it takes an incident to reach you, not from the vendor default.
- The auditor's period is written down with the framework or contract that sets it.
- Daily rollups keep the maximum, not just the average, so the capacity planner still has the peaks.
- Status changes and alert history are never rolled up.
- Incident snapshots are exported on the day of the incident, before the rollup reaches them.
- Monthly summaries leave the live database for the archive, dated and checksummed.
- The retention matrix exists, has "who asked" and "why" filled in, and has a review date.
- The raw-to-hourly boundary was checked against real disk arithmetic, not a feeling.
Where to go next
Once you know who wants the data and for how long, the rest of the pillar turns that into numbers and settings. Storage math prices the matrix in disk. The tiers guide turns its columns into a ladder your product can enforce. Housekeeping keeps the disk from ending the negotiation early. And the archiving guide handles what leaves the database but must never be lost. All five live in Retention and Granularity: How Long to Keep What.
Put this into practice with SysPeep Monitor
Settling who gets what is easier when the history lives in a database you can see and query. SysPeep Monitor keeps its metric and status history in SQLite for small installs, or MySQL/MariaDB or SQL Server for larger ones. It shows history, graphs and reports from one web console. For the retention settings themselves, check the product documentation. The free trial installs on any Windows machine.
Download Free TrialLearn About SysPeep - All Rights Reserved.