
SNMP Traps vs. Polling: Designing a Strategy That Uses Both
There are exactly two ways your monitoring system can learn that something happened on a device. Either it asks, sending SNMP questions on a schedule and reading the answers. This is called polling. Or the device tells it, firing off an unsolicited "something just happened!" message the moment an event occurs. That message is called a trap. Ask any two network people which approach is better and you can lose an afternoon.
The afternoon is wasted, because it is the wrong question. Polling and traps are not competitors. They are two delivery channels with opposite strengths and opposite failure modes. Every solid monitoring design uses both — deliberately, with each kind of information assigned to the channel that suits it. By the end of this guide you will know how each channel actually works and what belongs where. You will know how to set up and test the trap path, and how to defend against the classic failures. That includes the quietly terrifying one where a lost trap makes a broken device look perfectly healthy.
In this guide
- Two delivery models: asking versus shouting
- Strengths and blind spots, honestly stated
- What belongs in which channel
- Trap mechanics: sender, receiver, and the MIB in between
- Informs: traps with receipts
- The classic failure modes (and their preventions)
- A worked example: one small network's matrix
- Where to go next
Two delivery models: asking versus shouting
Polling is the model you already know if you have ever run an snmpwalk by hand. The monitoring server sends a question to the device's SNMP port (UDP 161). The device answers, and the server records the answer. Monitoring software simply does this on a timer — every device, a chosen set of values, every one to five minutes, forever. The rhythm is entirely under your control, which is the source of everything good and bad about polling. (If the request/response picture is fuzzy, the how monitoring works guide draws it from the very beginning.)
Traps reverse the arrow. You tell the device, once, where your monitoring server lives. From then on, the device sends a message whenever something it considers noteworthy occurs. A link goes down, a power supply dies, or someone saves a config change. The device immediately sends a small message to that address, on UDP port 162, describing the event. No question was asked. The device shouts, once, and goes back to work. Crucially, it does not check whether anyone heard. A plain trap is fire-and-forget, a single unacknowledged UDP packet with no retry and no delivery guarantee.
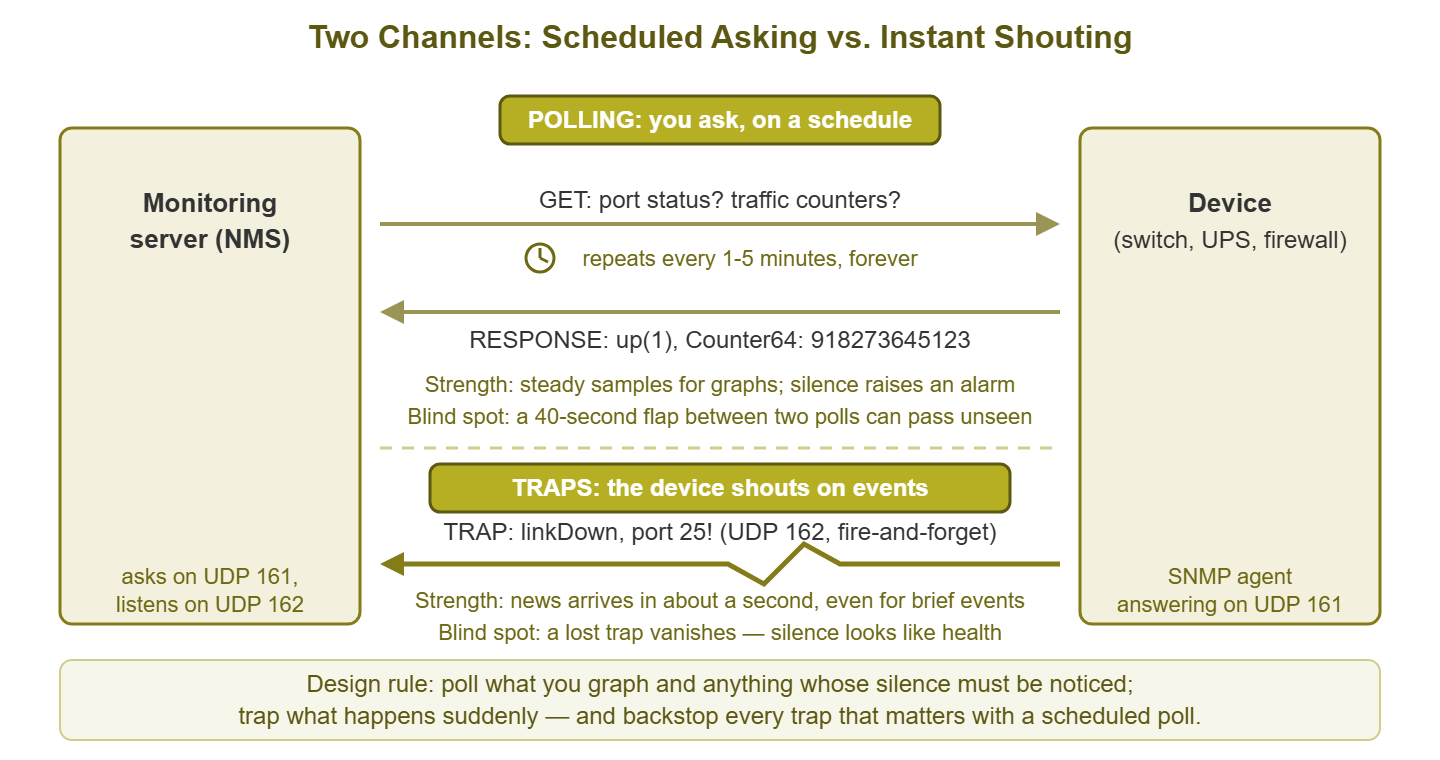
Figure 1: The two channels side by side. Polling is scheduled question-and-answer; a trap is the device shouting the moment an event happens. Each lane's weakness is written along it — and each lane's weakness is the other lane's strength.
Strengths and blind spots, honestly stated
Polling's great virtue is that silence is a signal. Your server expects an answer every cycle. So when a device stops answering, that very absence raises an alarm. A dead device announces itself by failing to reply. Polling also produces evenly spaced measurements, which is exactly what graphs and trend analysis need. A traffic counter read every minute becomes a bandwidth chart. A temperature gauge read every five becomes a cooling story. The blind spot is the gap between polls. A port that flaps down and back up in forty seconds, between two five-minute polls, can pass unseen. A brief CPU spike vanishes the same way. You can shorten the gaps, but only at the cost of more traffic and more load on devices, and a gap always remains.
Traps invert every one of those properties. Their virtue is immediacy: news arrives in about a second, not at the next scheduled visit. Even events too brief to survive until the next poll get reported. They cost almost nothing while things are quiet. But the blind spot is severe: a trap is one unacknowledged packet. A trap that is lost in transit, blocked by a firewall, or sent while your receiver is down simply evaporates. And nothing anywhere notices. The device believes it reported; the monitoring system saw nothing; the dashboard stays green. In the polling channel, silence means trouble. In the trap channel, silence is what health sounds like — which means silence carries no information at all. A monitoring design that relies on traps alone is a design that cannot tell "all quiet" from "deaf."
One more asymmetry completes the picture: a device that loses power, hangs, or gets unplugged sends no trap about it. Announcing your own death is hard. Only polling notices the stopped heartbeat. That single fact is why polling is always the foundation and traps are always the accelerant, never the other way around.
What belongs in which channel
The assignment rule falls straight out of the properties. Anything you graph, poll. Continuously varying state — traffic counters, CPU and memory, temperatures, client counts, disk space — needs evenly spaced samples, which only a schedule provides. Devices do not send traps saying "my counter went up a bit," and you would not want them to.
Discrete events, trap — the things that happen at a moment rather than vary over time. Examples include a link changing state, a power supply or fan failing, or a UPS switching to battery. They include an HA pair failing over, a configuration being changed, or a device rebooting. For these, the trap's immediacy is exactly what you want, and no polling cadence can match it.
And then the clause that makes the design robust: for every event you truly cannot afford to miss, add a polling backstop. This is a scheduled check of the same underlying state the trap reports. The uplink whose linkDown trap should arrive in a second is also polled for its port status every couple of minutes. If the trap is lost, the poll catches the fact a little late instead of never. The trap gives you speed; the backstop gives you certainty; together they give you both, at the price of a little redundancy. This trap-plus-backstop pattern is the single most useful idea in this guide.
Choosing the polling cadence is its own small judgment call, and "it depends" is the honest answer. But it depends on exactly two things: how fast the value can meaningfully change, and how expensive the question is. Reachability and critical port states earn the tightest cycles (a minute or two). Traffic counters do well at one to five minutes. Slow-moving state like disk capacity or a sensor inventory is happy at fifteen minutes or an hour. Tightening every interval "to be safe" mostly buys you more load on devices and fatter databases, not more insight. Spend the fast cycles where the answers can actually change fast.
Trap mechanics: sender, receiver, and the MIB in between
Setting up the sending side happens on each device. Every vendor's syntax differs, but the shape is always the same three decisions. Choose where to send, which credentials or version to use, and which event categories to report. On CLI-style gear it looks roughly like this:
# Generic shape - your device's syntax will differ
snmp-server host 192.0.2.10 version 2c TrapCommunity   # where + how
snmp-server enable traps                               # which events (often per-category:
                                                       # ... enable traps snmp linkdown linkup)
On web-managed devices the same three decisions appear as form fields, usually on the SNMP or Notifications page. Use a distinct community string for traps (it authenticates nothing on the receiving end by default, but hygiene is hygiene). And remember the network path. Every firewall between the device and your monitoring server must allow UDP 162 in that direction. Otherwise your traps will die politely en route.
The receiving side is your monitoring system listening on UDP 162. Most NMS platforms have a trap receiver built in. For lab work the Net-SNMP toolkit includes snmptrapd, a bare-bones receiver that prints whatever arrives. It is perfect for testing the pipe before trusting it.
What actually arrives is compact. It includes the device's current uptime and an OID naming which event this is (carried in a field called snmpTrapOID). A few attached variables give specifics. A linkDown trap, decoded by a receiver with its MIBs in order, reads something like this:
sw-core-01 [UDP: [192.168.1.2]:161]:
  DISMAN-EVENT-MIB::sysUpTimeInstance = Timeticks: (812455100) 94 days, 0:49:11
  SNMPv2-MIB::snmpTrapOID.0 = OID: IF-MIB::linkDown
  IF-MIB::ifIndex.25 = INTEGER: 25
  IF-MIB::ifOperStatus.25 = INTEGER: down(2)
Read it top to bottom: who sent it, how long they had been up, what happened (linkDown), and to which port (index 25). That is the same interface index you know from walking. So the trap joins up with everything you already poll about that port. That "OID naming the event" line also explains a rite of passage every admin goes through. Trap definitions live in MIB files, just like everything else in SNMP. If the receiver does not have the MIB that defines a trap, the event displays as a raw numeric OID. That means a cryptic 1.3.6.1.4.1.<something> instead of "psuFailure." The fix is the same as ever: load the vendor's MIBs on the receiver. The OIDs and MIBs guide covers finding and loading them. And the standard events at least arrive readable everywhere. They include linkDown, linkUp, coldStart (the device booted). There is also authenticationFailure (someone knocked with the wrong credentials — worth watching for its own reasons).
One version note before moving on: notifications inherit the same security story as everything else in SNMP. The v1 traps use an older packet format (receivers handle both). The v2c traps ride with a plaintext community string. And v3 can authenticate and encrypt notifications just as it does queries. The versions guide covers those trade-offs, and they apply to the shouting lane exactly as to the asking lane.
Informs: traps with receipts
SNMP's designers knew fire-and-forget was fragile, so later versions added the inform: a notification that expects an acknowledgement. The receiver replies "got it"; if no reply comes, the sender waits and retries, several times, before giving up. Where devices and receiver both support informs, the lost-packet problem shrinks dramatically — one dropped datagram no longer erases an event.
Honesty requires the fine print. Retries cost the device memory and state, so some platforms cap how many unacknowledged informs they will track. Support is uneven, especially on small and embedded gear. And informs still cannot repeal the deeper law: a device that lost power retries nothing. If the receiver is down for longer than the retry window, the event is gone anyway. So the guidance is: prefer informs over plain traps wherever both ends support them, and keep the polling backstop regardless. Informs upgrade the shout to certified mail; they do not upgrade it to a guarantee.
The classic failure modes (and their preventions)
The missed trap
The signature failure: a PSU dies at 2 AM, and the trap is dropped somewhere along the way. For three weeks a chassis runs on one power supply with a green dashboard. The problem is discovered only when the second supply fails. One lost packet, weeks of false comfort. Prevention: the backstop poll. Every state whose loss would embarrass you gets polled on a schedule as well. Poll sensor tables daily or hourly, and critical ports every few minutes. Add informs where supported.
The trap storm
A cable goes marginal and the link flaps — down, up, down, up — several times a second. Each transition fires a trap. Thousands of messages an hour bury your receiver, drown genuine alerts in the flood, and burden the struggling device too. Prevention: rate limiting at both ends. Many devices offer trap throttling or link-event dampening (holding a flapping interface down until it stabilizes). Good receivers deduplicate repeats into "linkDown ×3,412." And treat the storm itself as the alarm it is: the fix for a flapping link is a new cable, not a bigger inbox.
The unconfigured (or untested) receiver
Traps were configured on the device, and the receiver listens dutifully. But a firewall in between silently eats UDP 162. Or the device sends from an unexpected source address the receiver ignores. Everything looks configured; nothing has ever actually arrived, and because silence looks like health, nobody knows. Prevention: test the path end to end on setup day, in both directions of confidence. Use the device's own "send test trap" button if it has one. From a shell you can generate one manually. The Net-SNMP snmptrap command sends a synthetic event to whatever receiver you name:
# Send a test trap (a coldStart) to the receiver, then confirm it arrived
snmptrap -v2c -c TrapCommunity 192.0.2.10 '' 1.3.6.1.6.3.1.1.5.1
(The empty '' means "use current uptime"; the long OID is the standard coldStart event.) The test is not "the command ran" — the test is the event appearing in the monitoring console. If it does not, you have just found the silent firewall on a calm Tuesday instead of during an outage.
Traps to a dead address
Years pass. The monitoring server is rebuilt or renumbered. And every device on the network keeps faithfully shouting at the old IP forever. Trap destinations are configured per device, so an NMS migration quietly orphans all of them. Prevention: the forgotten-forwarding audit. Whenever the monitoring address changes, sweep device configurations for the old one (config backups make this a text search). Then re-test a sample with the synthetic trap above. Better still, prevent it structurally. Point devices at a DNS name where they support it. Or treat the trap-receiver IP as a permanent address that migrates with the role.
Tip: make the synthetic test trap a scheduled habit, not a one-time setup step. A monthly test event from a representative device, expected to appear in the console, converts the trap channel's dangerous silence into something you actively verify. It is a heartbeat for the shouting lane.
A worked example: one small network's matrix
Here is how the whole design lands for a typical small shop — a couple of switches, a firewall, a UPS, a few servers. The matrix is the deliverable: every metric or event, its channel or channels, and the reasoning. Yours will differ in detail, but probably not in shape:
| Metric or event | Channel(s) | Why |
|---|---|---|
| Interface traffic counters | Poll (1–5 min) | Graphs need evenly spaced samples; there is no trap for "counter climbed" |
| CPU, memory, temperature | Poll (5 min) | Trend data for capacity and cooling stories; thresholds fire from polls |
| Device up/down | Poll (1 min) | A dead device sends nothing; only missed answers reveal it |
| Uplink / core port status | Trap + backstop poll (2 min) | Want the news in seconds; cannot afford a lost packet to hide it |
| Access-edge port status | Poll only, relaxed | Users unplug laptops all day; traps here would be pure noise |
| UPS on battery / low battery | Trap + 1-min poll of battery state | Instant warning matters; the poll catches a lost trap while runtime remains |
| PSU or fan failure | Trap + hourly poll of sensor table | Rare, urgent, and the classic missed-trap embarrassment — backstop it |
| Config change | Trap | Instant audit trail; if one is lost, config backups still tell the story |
| HA failover | Trap + poll of HA state each cycle | Must know immediately; must also never believe a stale state |
| Trap path itself | Monthly synthetic test trap | The only cure for a channel whose failure mode is silence |
Read the pattern out of the table: everything is polled at some cadence. Polling is the foundation that notices death and feeds the graphs. Traps are layered on top of the handful of events where minutes matter. Every trap that carries real weight has a polling backstop. Its cadence is chosen by how long you can tolerate not knowing. That last phrase is the design question to ask of every row: "if the trap is lost, how late may the poll be?" For a UPS on battery, a minute. For a fan, an hour is defensible. Write the answer down, and the matrix practically fills itself in.
Where to go next
The argument that opened this guide dissolves once you stop asking "which is better?" and start asking "which channel does this information deserve?" Poll what you graph and everything whose silence must be noticed. Trap what happens suddenly and matters fast. Backstop every trap you cannot afford to lose. Test the shouting lane on a schedule, because its natural failure mode is a comfortable, healthy-looking silence. Design that way and the 2 AM surprises get rarer — and shorter. From here, the securing SNMP guide covers protecting both channels (your trap receiver is a listening service, after all). The rest of the SNMP Monitoring library fills in versions, OIDs, and troubleshooting. And if the push idea itself appeals to you — devices streaming their state instead of waiting to be asked — that instinct, matured, is streaming telemetry.
Put this into practice with SysPeep Monitor
Whatever mix of traps and polls you design, the polling half has to run like clockwork. It checks every device, every cycle, with silence treated as news. SysPeep Monitor polls your network over SNMP around the clock and graphs what it collects. It applies thresholds, dependencies, and alert rules built to surface real problems without flooding you. The free trial installs on one Windows machine and discovers your devices on its own.
Download Free TrialLearn About SysPeep - All Rights Reserved.