
Degradation Creep: The Slow Decline Nobody Alerts On
Most outages do not arrive out of nowhere. They arrive at the end of a long, quiet slope. An error counter might climb for two months. A firewall might lose a little memory every day since its last reboot. A disk might fill at a steady half a gigabyte a week. Every one of those numbers was sitting in your monitoring system the whole time. Nothing alerted, because nothing crossed a line.
That slow slide is degradation creep, and it is the most preventable kind of outage there is. A threshold cannot see it, because thresholds look at where a number is, not where it is going. A busy admin cannot see it either, because today always looks like yesterday. Only a long graph and a person willing to look at it can.
By the end of this guide you will know what creep looks like in five common places and why your alerts are blind to it. You will know the habit of looking at the same metric over a day, a month, and a year. That habit makes creep hard to miss. You will also leave with a creep candidates table you can fill in for your own network this afternoon.
In this guide
- What degradation creep is
- Five creeps, told concretely
- Why fixed thresholds miss it
- Why people miss it too
- How to look: a day, a month, a year
- The daily-maximum view
- Where creep ends
- A creep candidates table you can copy
- The creep checklist
- Where to go next
What degradation creep is
Degradation creep is a metric moving in the wrong direction slowly enough that no threshold fires and no day looks different from the day before. Every clause in that definition earns its place. "Wrong direction" means the number is getting worse, not merely changing. "Slowly enough" means the change per day is smaller than the wobble per day, so it hides inside the noise. And "no day looks different" is why it survives: whoever glances at the dashboard each morning is comparing today with yesterday, and today is fine.
The useful way to think about creep is as a slope rather than a level. A level is where a number is right now: 71 percent of the disk used, 6 milliseconds of latency, 40 errors on a port. A slope is how fast that number is changing: one percent a week, half a millisecond a month, ten new errors a day. Levels are what thresholds and dashboards show you. Slopes are what break things. This whole pillar is about learning to see the slope.
A baseline helps here, but it is not the same thing. A baseline is a record of what normal looked like over a settled period, something to compare today against. The guide on what a baseline is covers building one. Creep is what happens when the baseline itself drifts so gradually that you keep accepting each new normal as the old one. (A baseline that quietly moves with the problem is not a baseline. It is an accomplice.)
Five creeps, told concretely
Creep is easier to recognise by example than by definition, so here are five I have watched happen in five corners of an ordinary network. None is exotic. Each was visible for weeks before it did any damage.
An error counter climbing on one uplink
An uplink is the port that carries traffic between two switches. And one of yours starts logging a few dozen input errors a day where a month ago it logged none. The cause is nearly always physical: a cable pinched under a rack rail, a transceiver on its way out, a patch panel socket re-plugged one time too many. The port stays up, and the traffic flows. And the errors climb in a straight line nobody sees, because the counter is displayed as a running total and running totals always go up. The guide on interface metrics that matter explains which counters to graph. The creep lives in the rate of new errors per day, not in the total.
Latency drifting from four milliseconds to nine
Latency is the round-trip time for a small packet to reach a device and come back. Yours to the file server was four milliseconds when you last looked. It is nine now. No single day moved it by more than a fraction, and nine is still far below any alert you would set. But something more than doubled the delay, and that something is usually load. Think of a link filling up, a firewall inspecting more than it used to, or a virtual host carrying more guests. The guide on expected latency baselines explains what a healthy number looks like. The creep is the slow journey from one healthy number to a worse one.
A memory leak on a firewall
A memory leak is a bug where a program takes memory to do a job and forgets to give it back. On a firewall, the free-memory graph becomes a very gentle ski slope: down a fraction of a percent every day, back to the top after a reboot, then down again. One day it reaches the bottom, and the device reboots itself, or stops accepting new connections, or quietly drops the sessions it can no longer track. Which happens depends on the vendor. None is good.
A disk filling
The classic. Log files, a database, a backup staging folder, a mailbox store. Disk use is the friendliest creep because it is nearly always a straight line and the end is a known number: one hundred percent. It is also the one most people already alert on, at 85 or 90 percent. That is fine if the disk fills over a year. It is useless if the last ten percent goes in a weekend because a job started writing debug output. The threshold is not wrong. It simply has no idea how fast the number is arriving.
A fan slowing
Fans wear. A fan that spun at 4,000 revolutions per minute when the switch was new spins at 3,600 two years later. The temperature sensor on the same board climbs a degree or two to match. Neither number is near its alarm value. But the fan is telling you it will fail, the temperature is telling you roughly when, and both are doing it in a whisper. The temperature and humidity guide covers the environmental side properly.
Why fixed thresholds miss it
A fixed threshold is a line drawn at a level: alert when disk use passes 90 percent, when latency passes 50 milliseconds, when temperature passes 35 degrees. It sees exactly one thing, whether the number is above the line or below it. It has no memory. It does not know the number was ten points lower last month, and would not care if it did.
That blindness is not a flaw in thresholds; it is what they are for. A threshold answers "is this bad right now?" and answers it well. Creep asks a different question: "is this heading somewhere bad?" The guides on dynamic thresholds and percentile thresholds get you part of the way by letting the line move with the data. The rest of the way is trend alerting, which the guide on alerting on trends covers.
The arithmetic makes the gap obvious. Suppose your disk threshold is 90 percent, the disk is at 60 percent, and it is growing one percent a week. The threshold fires in thirty weeks. For twenty-nine of them the monitoring system's considered opinion is that everything is fine. It is not lying. It was not asked the right question.
Why people miss it too
People miss creep for a simpler reason: we compare today with yesterday, and yesterday was fine. Eyes are excellent at spotting a difference between two pictures side by side, and poor at noticing that both differ from one taken three months ago. A dashboard showing the last hour feeds that weakness perfectly. Every morning, the graph looks like the graph.
The other reason is that the default time window in nearly every monitoring tool is short. Open a device page and you get the last few hours. That is the right default for troubleshooting, where you want to know what happened at 09:14. It is the wrong one for creep, where only what has happened since March matters. Nobody changes the default, so nobody sees the slope. I ran a monitoring system for two years before I noticed the time-range selector had a "one year" option. It had been there the whole time, waiting patiently.
The third reason is that looking for creep is never urgent. Nothing is on fire and the graph will still be there tomorrow. Important-but-not-urgent work gets done only when it has a fixed slot in the calendar. That is why the last guide in this pillar is about a thirty-minute weekly review and not about willpower.
How to look: a day, a month, a year
The single most useful habit in this pillar is to look at the same metric over three windows side by side. Use the last 24 hours, the last 30 days, and the last 12 months. Each window answers a different question, and creep is only visible in the long one.
The day view shows noise and shape. Business hours, the backup at 02:00, the lunchtime dip. It tells you whether the metric is alive and behaving, and it is where you troubleshoot a spike. It shows nothing about creep, because a slope of one percent a week is six thousandths of a percent an hour, invisible under any noise. (The guide on granularity blind spots covers what a polling interval cannot see; creep, measured in weeks, is not on that list.)
The month view shows rhythm and hints. You can see weekdays against weekends, month end against mid-month, and the first faint tilt if a metric is drifting. It is where you start to suspect. The guide on seasonal patterns explains the weekly and monthly rhythms. That helps you tell a cycle that repeats from a trend that does not.
The year view shows the truth. The noise averages into a band, the weekly rhythm becomes a texture, and the slope stands up and introduces itself. If a number is creeping, the year view is where the line walks from bottom-left towards top-right and does not come back. That is the third panel of Figure 1, and it is the picture every post-incident review eventually finds.
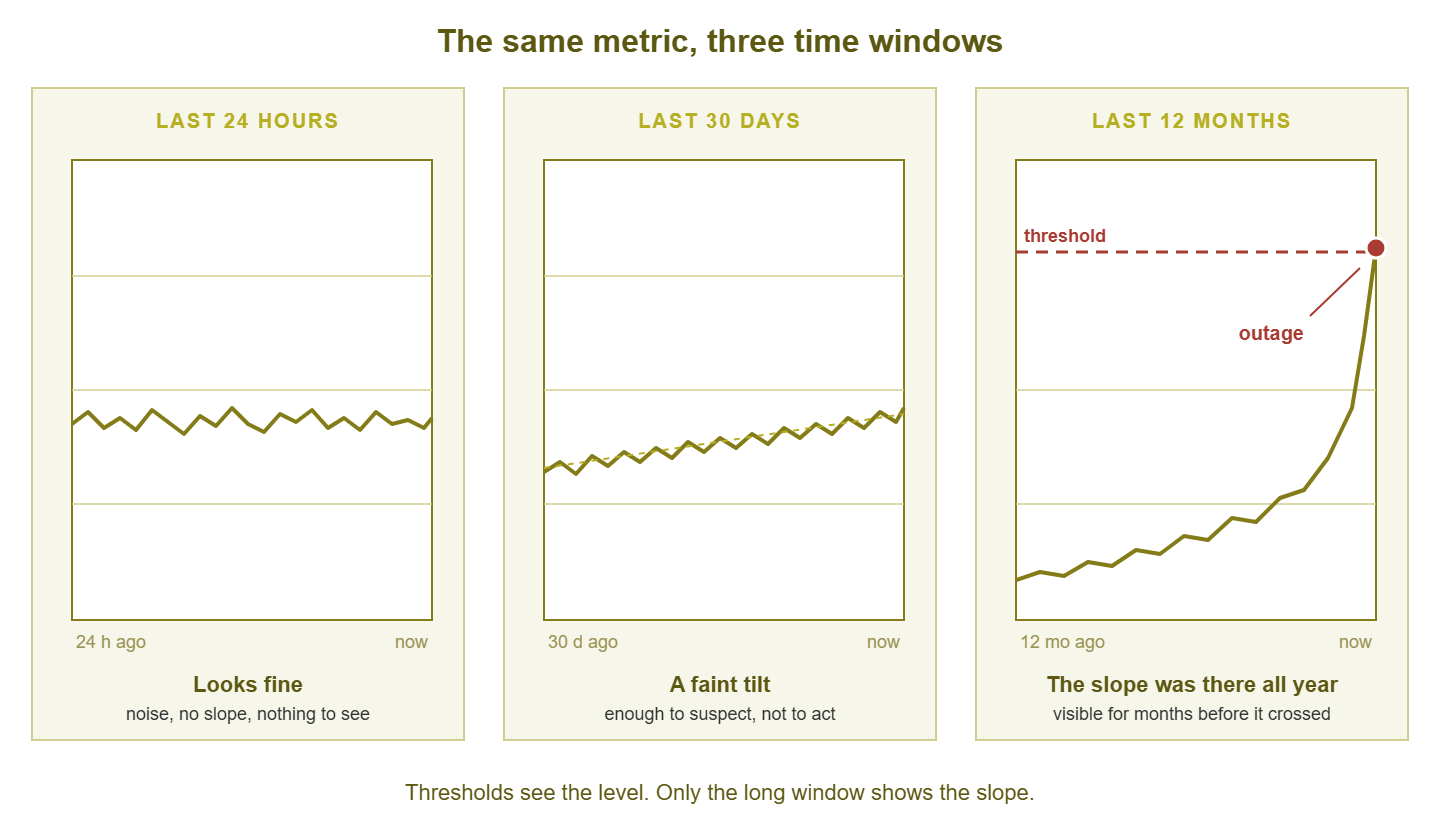
Figure 1: The same counter over a day, a month, and a year. The day view looks fine, the month view hints, and only the year view shows the slope that ends at the outage.
Do this for one metric today. Pick the free-memory graph on your busiest firewall, set the window to a year, and look. If the line is flat, good. If it is a row of ski slopes with a reboot at the foot of each, you have found your first creep in under a minute.
Tip: keep the vertical axis the same on all three windows if your tool lets you. Auto-scaling stretches a two-percent wobble to fill the panel, so a flat day looks dramatic and a rising year looks modest. A fixed axis from zero to the threshold tells the truth in all three views.
The daily-maximum view
The year view only works if the data survives that long, and monitoring systems thin data as it ages. A rollup, one summary number standing in for many raw samples, is how a year of five-minute readings fits in the database. The guide on rollups and retention explains how it works and what it hides. For creep, the question is which summary number your tool keeps. A daily average is fine for disk and memory, which move smoothly. It is nearly useless for error counters and latency, where the problem lives in the peaks and the average politely smooths them away.
The daily maximum is the rollup that shows creep best. If your tool keeps the highest value each day for a year, you get 365 points, each one the worst that day got. Creep in the peaks then shows as a rising staircase of daily worsts. A metric whose average is flat but whose daily maximum is climbing is telling you the bad moments are getting worse even though the typical moment is not. That is usually the first sign of a capacity problem, long before the average moves. Check your retention settings and make sure the daily maximum (and the daily minimum, for things like free memory) is kept alongside the average.
You can build the same view yourself from exported data. Export a metric as CSV with a timestamp column and a value column, and a short script gives you the daily worst.
# daily_max.py - print the highest value per day from a CSV of timestamp,value
import csv, sys
from collections import defaultdict

worst = defaultdict(float)
with open(sys.argv[1], newline="") as f:
    for ts, val in csv.reader(f):
        day = ts[:10]                      # "YYYY-MM-DD" from the timestamp
        worst[day] = max(worst[day], float(val))

for day in sorted(worst):
    print(day, worst[day])
Paste the output into a spreadsheet and chart it, and you have a daily-maximum view. The slope is then one formula away. Put dates in column A, daily maxima in column B, and the threshold in cell D1. Then =SLOPE(B2:B366, A2:A366) gives the change per day. The formula =(D1 - B366) / SLOPE(B2:B366, A2:A366) gives the days left before the line reaches the threshold. I keep that second formula on every capacity sheet. It is the least dramatic number in the workbook and the only one anyone ever asks about.
Where creep ends
Creep ends in one of two places. The first is the outage: the disk fills, the firewall reboots, the fan stops. The uplink's errors turn into drops, and the drops turn into a site that cannot reach its file server. That is the expensive ending, and it comes at the worst time. A slope three months long does not care what day it is when it reaches the line.
The second ending is the review. After the outage, someone opens the graph and sets the window to a year. There it is: a clean line from bottom-left to top-right, three months long, crossing the threshold on the morning of the outage. Everyone in the room can see it. Everyone in the room could have seen it three months ago. This pillar exists to move that moment of looking from after the outage to before it.
Harbourview Clinic ran a pair of firewalls at its main site. The primary had a memory leak that lost about a third of a percent of free memory a day. The monitoring system graphed it faithfully and alerted on nothing. The alert was set at five percent free. The firewall fell over at about eight, when its own processes ran out of room. The reboots landed whenever the leak reached the bottom, which turned out to be twice on a Friday afternoon and once during a Monday morning clinic session. After the third one, somebody set the graph to a year and saw a row of ski slopes with a reboot at the foot of each. The post-incident review described the pattern as "consistent". It was, in fairness, the most reliable thing on the network.
A creep candidates table you can copy
A creep candidate is any metric that can get worse slowly, and the table below is the register I keep for them. The columns are the questions you need answered before a weekly look is useful. They cover what the metric is, where you see it, which way is healthy, how far back you look, and who owns the answer. The rows shown are examples from an ordinary small network; fill in your own.
| Metric | Where to see it | Healthy direction | Look-back window | Owner |
|---|---|---|---|---|
| Uplink input errors, rate per day | Switch interface graph, core uplinks | Flat at zero | 90 days, daily maximum | Network admin |
| Round-trip latency to file server | Ping check history | Flat | 12 months, daily maximum | Network admin |
| Firewall free memory | Device health graph | Flat between reboots | 12 months, daily minimum | Firewall owner |
| Disk used, mail store volume | Server disk graph | Flat, or a slow and predictable rise | 12 months, daily average | Server admin |
| Switch fan speed and board temperature | Device sensor graph | Flat | 12 months, daily average | Network admin |
| Backup job duration | Backup report or job check | Flat | 6 months, daily value | Backup owner |
| Monitoring poll cycle duration | Monitoring server self-check | Flat | 6 months, daily maximum | Monitoring owner |
Keep it short. Ten rows is a register; forty is a list nobody reads. The guide on early-warning metrics has a longer catalogue to choose from. And the capacity planning from history pillar takes the disk and bandwidth rows on to a purchase date.
The look-back window differs per row because things creep at different speeds: a memory leak shows in ninety days, a disk in a year, a fan in two. The owner column exists because a graph without an owner is a graph nobody opens, and a finding without an owner is a sentence in a meeting. (Meetings are where findings go to be agreed with and then forgotten.)
The creep checklist
This is the first pass. It takes about an hour for a small network, most of it waiting for year-long graphs to render.
- Pick five metrics from the creep candidates table and set each one's graph to twelve months.
- For each, write down whether the line is flat, rising, or a sawtooth with a reboot between each tooth.
- Confirm your retention keeps the daily maximum and minimum, not only the daily average, for at least a year.
- Put a twelve-month view of each candidate on one page you can open with a single click.
- For any metric that is rising, compute the slope and the days until it reaches its threshold.
- Write the days-until figure and an owner next to each rising metric.
- Book thirty minutes next week to look at the same page again.
The last item is the one that matters. A single look finds the creep that is already there. Only a repeated look finds the creep that starts next month.
Where to go next
Creep is a slope, thresholds see levels, and the fix is a longer graph looked at on purpose. Not every rising line means the same thing, though. The next guide, reading growth curves, teaches you to tell a healthy linear rise from a step, a season, and a runaway. The rest of the Trend Analysis and Degradation Creep pillar builds from there to trend alerts and a weekly review that fits in half an hour.
Put this into practice with SysPeep Monitor
Catching creep needs three things from your monitoring tool. First, it needs a year of history for every metric. Second, it needs a page where twelve-month graphs of your creep candidates sit side by side. Third, it needs thresholds you can tune once you know the slope. A single Windows service gives you all three. It offers SNMP, WMI and SSH collectors, long-term graphs, thresholds and alert rules, and dashboards and reports from one web console. The free trial installs in minutes.
Download Free TrialLearn About SysPeep - All Rights Reserved.