
The Nines, Translated: What 99%, 99.9%, and 99.99% Really Mean
Sooner or later, somebody with a budget asks you the uptime question. A manager wants "what's our uptime?" for a report. A vendor's brochure promises "99.99% availability" in a confident font. Or you are writing your first internal service commitment and looking at the blank where the number goes. All the nines look nearly identical on paper. 99%, 99.9%, and 99.99% differ by less than one percentage point, and that resemblance is the most expensive optical illusion in IT.
The gap between those numbers is the gap between "we fix it after coffee" and "we built everything twice and nothing may ever depend on a single human waking up." The first is a habit. The last is an architecture with a staff. I have sat in a meeting where "five nines" was said about a system with one server and one power supply. Nobody in the room had done the division. I was in the room.
This guide translates the nines into plain language. By the end you will be able to convert any availability percentage into real minutes and hours of allowed downtime. You will recognize what each tier honestly demands in engineering and money, and tell a marketing nine from a measured nine. You will be able to pick a sensible target for each of your services, because they should not all get the same one.
In this guide
- What a "nine" actually measures
- The downtime table
- What each tier honestly demands
- The multiplication trap: chained dependencies
- Marketing nines vs. measured nines
- Pick a target per service, not per company
- What moves you up a tier
- The question that prices it all
What a "nine" actually measures
Availability is the percentage of time a service was working, out of the total time it was supposed to be working. The formula is just division: take the measurement window (say, a month), subtract the downtime, and divide by the window. "The nines" is shorthand for how many 9s appear in the result — 99% is "two nines," 99.9% is "three nines," 99.999% is the famous "five nines." Each extra nine divides the allowed downtime by ten, which is why the tiers that look like siblings are really separated by an order of magnitude each.
The percentage hides two traps immediately. First, it compresses big absolute numbers into small-looking decimals. For example, 1% of a year does not sound like much until you write it as three and a half days. Second, every word in "time the service was working" turns out to be negotiable — what counts as working, what counts as supposed to be, and who was measuring. Those arguments get their own guides in this library: defining "down" covers what counts, and honest availability math covers how to compute the number without fooling anyone, including yourself. This guide handles the part that comes first: what the tiers mean and which one you should even be aiming at.
The downtime table
Here is the canonical translation table. It uses a 365-day year, a 30-day month, and around-the-clock measurement (24×7). The numbers are simple arithmetic — the allowed downtime is just the missing fraction of the period — but seeing them written out is what makes the tiers real.
| Availability | Nickname | Per year | Per month | Per week | Per day |
|---|---|---|---|---|---|
| 99% | two nines | 3.65 days | 7 h 12 m | 1 h 41 m | 14 m 24 s |
| 99.5% | — | 1.83 days | 3 h 36 m | 50 m 24 s | 7 m 12 s |
| 99.9% | three nines | 8 h 46 m | 43 m 12 s | 10 m 5 s | 1 m 26 s |
| 99.95% | — | 4 h 23 m | 21 m 36 s | 5 m 2 s | 43 s |
| 99.99% | four nines | 52 m 34 s | 4 m 19 s | 1 m 0 s | 8.6 s |
| 99.999% | five nines | 5 m 15 s | 26 s | 6 s | 0.86 s |
Read it slowly once. At 99%, a service can be dark for the length of a long weekend every year and still hit its number. At 99.9%, the entire annual budget is one working day — a single bad afternoon with a dead switch and a slow parts delivery spends it all. At 99.99%, the year's allowance is less than one lunch break, and at five nines the service is allowed roughly the time it takes to read this paragraph aloud. Twice.
Tip: ignore the "per day" column when planning — downtime never arrives in polite daily installments. Real outages are lumpy: months of silence, then one four-hour disaster. The per-year column is the honest planning number, because one incident can eat the whole thing. The per-day column exists mainly to make five nines look as brutal as it is.
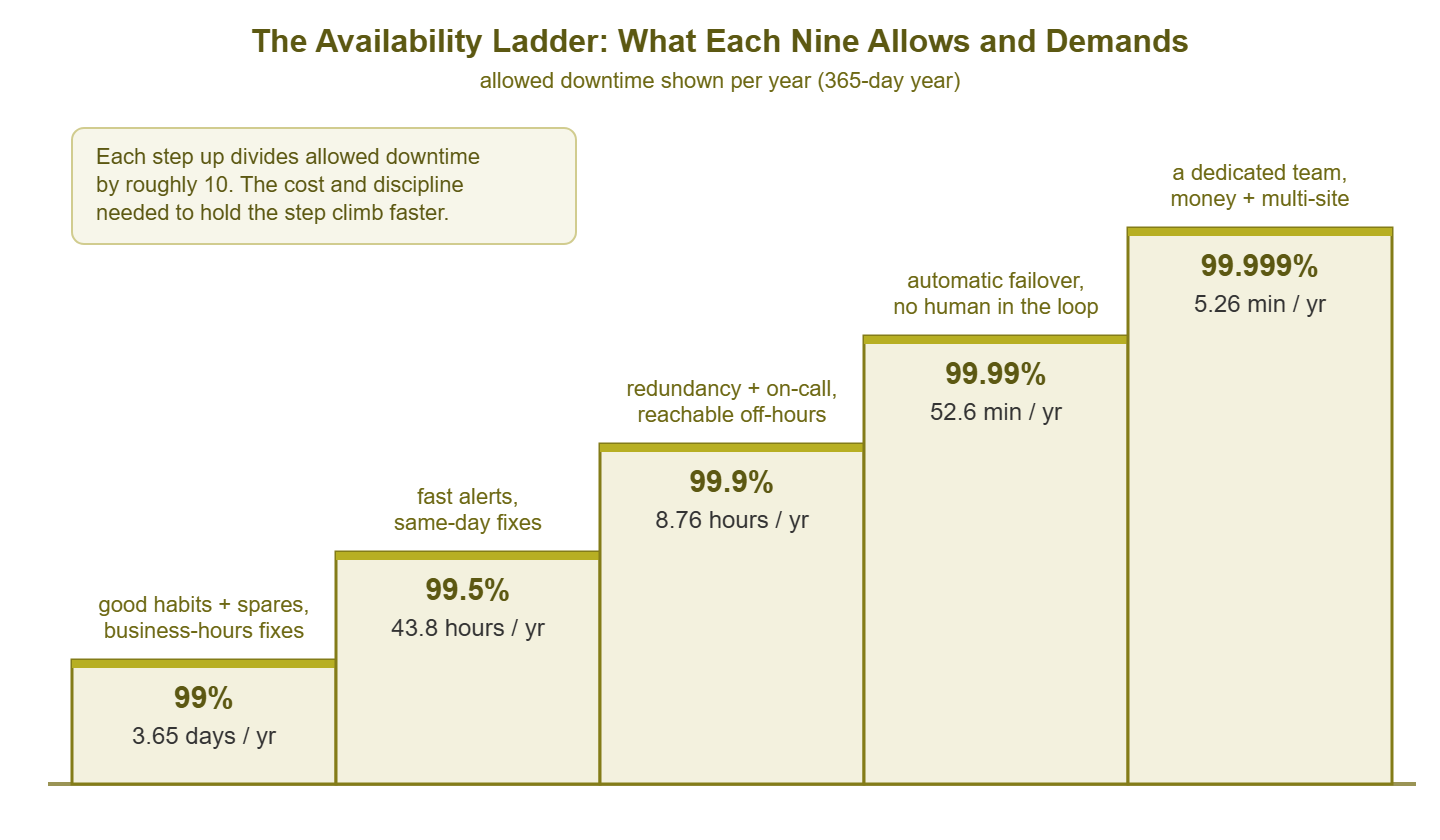
Figure 1: Each step up the ladder divides allowed downtime by roughly ten — and the cost of holding the step climbs faster than the number does.
What each tier honestly demands
The table tells you what each tier allows. The more useful translation is what each tier demands, because the nines are not prizes you claim. They are budgets you have to be engineered to stay inside, and the engineering is what the brochure leaves out.
Meridian Parts learned the difference between a prize and a budget on a Thursday. The proposal for their new order system had promised "99.99% availability" on the cover page. And the system underneath the cover page was one server with one power supply and one disk controller. Its maintenance contract promised a replacement part within two business days. The power supply failed at ten in the morning. By lunchtime the system had spent the year's four-nines allowance twice over, and by the time the part arrived on Monday it had spent roughly a century's. The post-incident review described the figure on the cover page as "aspirational."
99%: decent practices, honestly applied
Two nines is what a competently run, fix-it-when-it-breaks operation achieves naturally. You need monitoring that tells you something died before the users do (the first ten checks get you there). You also need tested backups, a spare switch and power supply on the shelf, and someone who fixes things during business hours. No redundancy required; a dead server can wait for a technician with coffee. The cost above just doing your job properly is roughly zero. Most small networks with one attentive admin live in the 99–99.5% range without ever computing it.
99.5%: the same, but faster
The half-step tier is mostly about response time. You still fix things rather than failing over, but fixes start the same day, not "when we get to it." Your alerting has to reach a human within minutes — including on a Saturday if the service matters on Saturdays. The money is small; the change is organizational: someone is always looking, and someone is always reachable. Skip the reachable part and a Saturday fault found on Monday turns a ten-minute fix into a weekend of downtime. That is most of the half-step's budget gone in one go.
99.9%: redundant parts, fast alerts, a reachable human
Three nines is where engineering starts. Your entire annual budget — 8 hours 46 minutes — must cover every unplanned failure and every patch reboot. The exception for patch reboots is if your policy explicitly excludes announced windows (see planned downtime). That arithmetic forces three things. First, redundancy for the likely failures. You need dual power supplies, RAID (several disks arranged so one can die without losing the data) or replicated storage. You need a second DNS and DHCP server. These services turn names into addresses and hand addresses out; without them, everything looks dead at once. You also need a UPS (an uninterruptible power supply, the battery that carries the rack through a short power cut). A single failed disk must not cost you six of your nine hours. Second, detection measured in minutes: an alert that reaches a phone, not an inbox that gets read on Monday. Third, an off-hours human: on-call, or at least a named person who answers. The cost is real but reachable for a small business. The point of 99.9% is that a component can die without the service dying, and a human still finishes the repair.
99.99%: automatic failover, no human in the loop
Four nines allows 52 minutes per year — about 4 minutes per month. Now do the arithmetic on a human response: page fires, person wakes, laptop opens, VPN connects, diagnosis begins… You have spent a month's budget before anyone has typed a command. The conclusion is unavoidable: at four nines, recovery cannot involve a person. Failover must be automatic and fast: clustered server pairs, high-availability firewall pairs, dual internet links that switch themselves. Every single point of failure has to go, including the quiet ones like "both nodes plug into one power strip." Failover also has to be tested regularly, because an untested failover is a rumor. The cost character changes here: you are roughly doubling infrastructure, adding engineering time, and adopting a permanent testing discipline. This tier is serious money, and most services do not earn it.
99.999%: a team and an architecture
Five nines — five minutes and fifteen seconds per year — is not a better version of the previous tier; it is a different industry. It implies multiple sites, geographic redundancy, automatic everything, deliberate failure testing, and an operations team on rotation. Telephone carriers chase it with departments. Most small and mid-size businesses neither need it nor can afford it, and that is fine — needing five nines is rarer than wanting them. When a salesperson says "five nines" casually, ask two questions: measured over what period, and defined as what? The pause that follows is usually the real answer.
The multiplication trap: chained dependencies
Here is the part that surprises almost everyone the first time. Suppose a user reaching your line-of-business app depends on five things in a row. They are the ISP (internet service provider) link, the firewall, the core switch, the server, and the application itself. Suppose each one, individually, manages a genuinely respectable 99.9%. What does the user experience?
Not 99.9%. Availabilities in a chain multiply, because the service is only up when every link is up at the same time, and each link fails on its own schedule. The chain's availability is 0.999 × 0.999 × 0.999 × 0.999 × 0.999 — about 99.50%. Watch what that does to the downtime:
| Links in the chain (each 99.9%) | Chain availability | Downtime per year |
|---|---|---|
| 1 | 99.90% | 8 h 46 m |
| 2 | 99.80% | 17 h 31 m |
| 3 | 99.70% | 26 h 15 m |
| 4 | 99.60% | 35 h 0 m |
| 5 | 99.50% | 43 h 43 m |
Five links, each allowed under nine hours, add up to nearly 44 hours a year of user-facing downtime — five times worse than any single link. The chain is always weaker than its weakest link, because everybody's bad days land on different dates. Two lessons fall out of this. First, the availability of the service a user sees is capped by the product of everything underneath it. So quoting your server's uptime as "the app's uptime" is flattering fiction. Second, when you want to improve the user's number, attack the worst link first — frequently the ISP connection. That is where a small fix moves the product most.
The same arithmetic, run in reverse, is why redundancy works so well. Put two independent things in parallel — two internet links from different carriers, say, each a mediocre 99%. The pair is only down when both are down at once: 0.01 × 0.01, which is 99.99% in theory. The theory has two load-bearing words. Independent: two links entering the building in the same conduit, or two servers on one power strip, fail together and multiply nothing. And the failover between them has to actually work, automatically, which is exactly the four-nines discipline from the previous section. Redundancy is how you buy nines; independence and tested failover are the fine print.
Marketing nines vs. measured nines
The nines you read in a vendor contract and the nines you measure on your own network are different animals wearing the same suit. A vendor's number usually lives in an SLA — a service level agreement. This contract section promises a level of service and defines a remedy if it is missed. Read the remedy clause closely: it is almost always a service credit, a small refund against a future bill. That makes an SLA a refund policy, not a forecast. If the provider misses 99.9% this month, you get a few percent off the invoice; your business still ate every minute of the outage. An SLA credit is compensation for downtime, not the absence of downtime.
The fine print does more quiet work. Marketing nines routinely exclude planned maintenance, "emergency" maintenance (a category with remarkable stretch), and anything blamed on factors outside the provider's network. They are also measured at the provider's edge. If their data center is healthy but the route between you and it is broken, many SLAs count that as "up." Your users count it as a very bad Tuesday. None of this makes SLAs useless; it makes them a floor for negotiation, not a description of your future. The belief that a vendor's advertised uptime equals the uptime you will experience belongs on the same shelf as the other monitoring myths.
Measured nines are the ones you can defend. Use your own checks, run from where your users sit, against a written definition of what "down" means. Compute the result with arithmetic you can show. Building those is the business of the rest of this library — layered checks that test the service and not just the box, and math that survives an audit. When a measured nine and a marketing nine disagree, the measured one is the one your users experienced.
Pick a target per service, not per company
The most common targeting mistake is picking one number for the whole company. "We aim for 99.9%" sounds tidy and is wrong-sized in both directions at once. It demands redundancy for systems nobody would miss for a day. It under-protects the one system whose failure stops payroll. Availability targets belong to services, because impact belongs to services.
For each service, ask four questions. Who is affected when it is down? What actually stops (revenue, a legal deadline, mild annoyance)? How expensive is an hour of that? How long can it be down before the damage turns serious? Then pick the cheapest tier that fits the answers. A sensible small-business spread looks something like this:
| Service | Sensible target | Why |
|---|---|---|
| Payroll / finance system | 99.9% | A missed pay run is a company-level event with a hard deadline |
| Order entry / line-of-business app | 99.9% | Revenue stops when it stops |
| 99.5–99.9% | Painful fast, but tolerates short gaps without lasting harm | |
| File server | 99.5% | Disruptive, but most work can shift for an hour |
| Intranet / wiki | 99% | Annoying, not damaging |
| Lobby TV dashboard | none | Reboot it when someone notices |
Notice what the spread buys you: your redundancy money concentrates on the two services that earn it, and everything else gets honest, cheaper care. The lobby television gets rebooted when somebody notices it, and nobody buys it a cluster. Setting the actual numbers — and getting the business to agree to them before an incident tests the agreement — is its own craft, covered in setting internal uptime targets.
What moves you up a tier
Tiers are bought with specific, unglamorous moves. Here is the climb, concretely, with the character of the cost at each stage:
- To a solid 99%: monitoring with alerting on the essentials, backups you have actually restored from, spares on the shelf, and written notes on how things are wired. Cost: mostly your time. This tier is won by habits, not hardware.
- To 99.9%: kill the likeliest single points of failure — second DNS/DHCP, dual power supplies, UPS, RAID or replication for anything stateful. Get alerts to a phone within minutes, name an off-hours human, and write runbooks so the fix takes twenty minutes instead of ninety. Then add change discipline: a healthy share of outages are self-inflicted, so announced maintenance windows and a rollback plan protect the budget from your own fingers. Cost: real money on duplicated components, plus the ongoing tax of being reachable.
- To 99.99%: automatic failover for every layer the service touches — clustered servers, HA firewall pair, dual ISPs with automatic switchover. Add scheduled failover tests, because the first time a cluster fails over must never be during a real failure. Cost: roughly doubling the infrastructure under the service, plus permanent engineering attention. Reserve it for services that provably earn it.
- To 99.999%: multiple sites, an operations team, and an architecture designed around failure. If a service genuinely needs this, buying it from a provider whose entire business is five nines is usually saner than building it.
Tip: before spending on the next tier, check where your downtime actually comes from. Suppose last year's hours were mostly "nobody noticed until 9 AM" or "the fix took four hours because nothing was documented." Then better alerting and a runbook buy you more nines than a cluster does — for roughly the price of a pizza.
The question that prices it all
Every tier decision reduces to one honest question: what does an hour of downtime actually cost your business, per system? Not in industry-average folklore — in your numbers. A rough estimate is enough, and it fits on a napkin:
cost per hour  =  (people affected  x  loaded hourly cost  x  fraction of their work blocked)
                + (revenue per hour that cannot happen while it is down)
                + (hard penalties: missed payroll, contract deadlines, spoiled batches)
Run that for each service on your list, multiply by the hours of downtime each tier would allow, and the targets pick themselves. If an hour of order-system downtime costs more than a second server, the second server is not an expense — it is the cheap option. If an hour of intranet downtime costs a shrug, then a 99.99% intranet is a hobby, not a strategy. The nines stop being abstract the moment they are denominated in your own money.
Where to go next
You can now take any nines claim, from a brochure or from a meeting. You can turn it into minutes, money, and the engineering it would actually take. Some claims survive that translation and some do not, and you will know which within a minute of hearing them. Two follow-ups make the knowledge operational. Make sure your checks measure the service and not just the hardware, in ping-up vs. service-up. Make sure the percentage you report is one you can defend, in honest availability math. The rest of the Uptime & Availability guides build from there. The next time someone says "five nines" in a meeting, you will be the person who does the division.
Put this into practice with SysPeep Monitor
Most of the climb from 99% to 99.9% is simply knowing the moment something breaks. SysPeep Monitor watches your devices and services around the clock with checks over SNMP, WMI, and SSH. Its thresholds and dependency rules keep alerts meaningful, and notifications reach you in minutes, not Monday. The free trial installs on any Windows machine.
Download Free TrialLearn About SysPeep - All Rights Reserved.