
Correlating Host-Side and Network-Side Data
Every IT department has played this game. The application is slow, and the app team says "it's the network." The network team pulls up a clean utilization graph and says "it's not the network." The ticket bounces between them like a shuttlecock while the users wait. The game has a name — blame tennis — and it has exactly one reliable ending: evidence from both ends of the wire, laid on the same timeline, read together.
That is what correlation means here, and it is less a tool than a discipline. Take one moment in time, gather what the host recorded about it and what the network gear recorded about it. And let the agreement — or the disagreement — tell you where the problem lives. This is the capstone skill of host-side monitoring. It turns all the counters, event logs, and probes from the other guides in this topic into verdicts. By the end you will have a three-step drill you can run during any incident, plus three worked cases showing the drill in action. You will have a cheap dashboard trick that makes the whole thing take minutes instead of an hour.
In this guide
- Two witnesses, one incident
- Step zero: agree on the clock
- The three-step correlation drill
- Reading the verdict: agreement and conflict
- Case one: the morning file-share crawl
- Case two: the one-user mystery
- Case three: the app-team standoff
- When correlation says "go deeper"
- The both-ends dashboard: making this cheap
- The drill, as a checklist
Two witnesses, one incident
Think of a network incident as a fender-bender with two witnesses standing on opposite corners. The host — the Windows workstation or server — saw the crash from the inside. Its TCP stack counted every retransmitted segment. Its event log noted the moment file-sharing gave up. Its DNS client knows exactly how long lookups took. The network — the switch, the firewall, the monitoring system polling them — saw it from the outside. It saw port utilization, error counters ticking up on one interface, a firewall rule quietly dropping packets. Neither witness saw everything. Either one alone can honestly tell you a story that is true and completely misleading.
Interviewed together, though, they are devastatingly effective — because each one covers exactly the other's blind spots. The host cannot see a saturated uplink two switches away. The switch cannot see that a process on the host was strangling its own connections. The whole method in one sentence: same timeline, both vantage points, then read where the stories agree and where they clash.
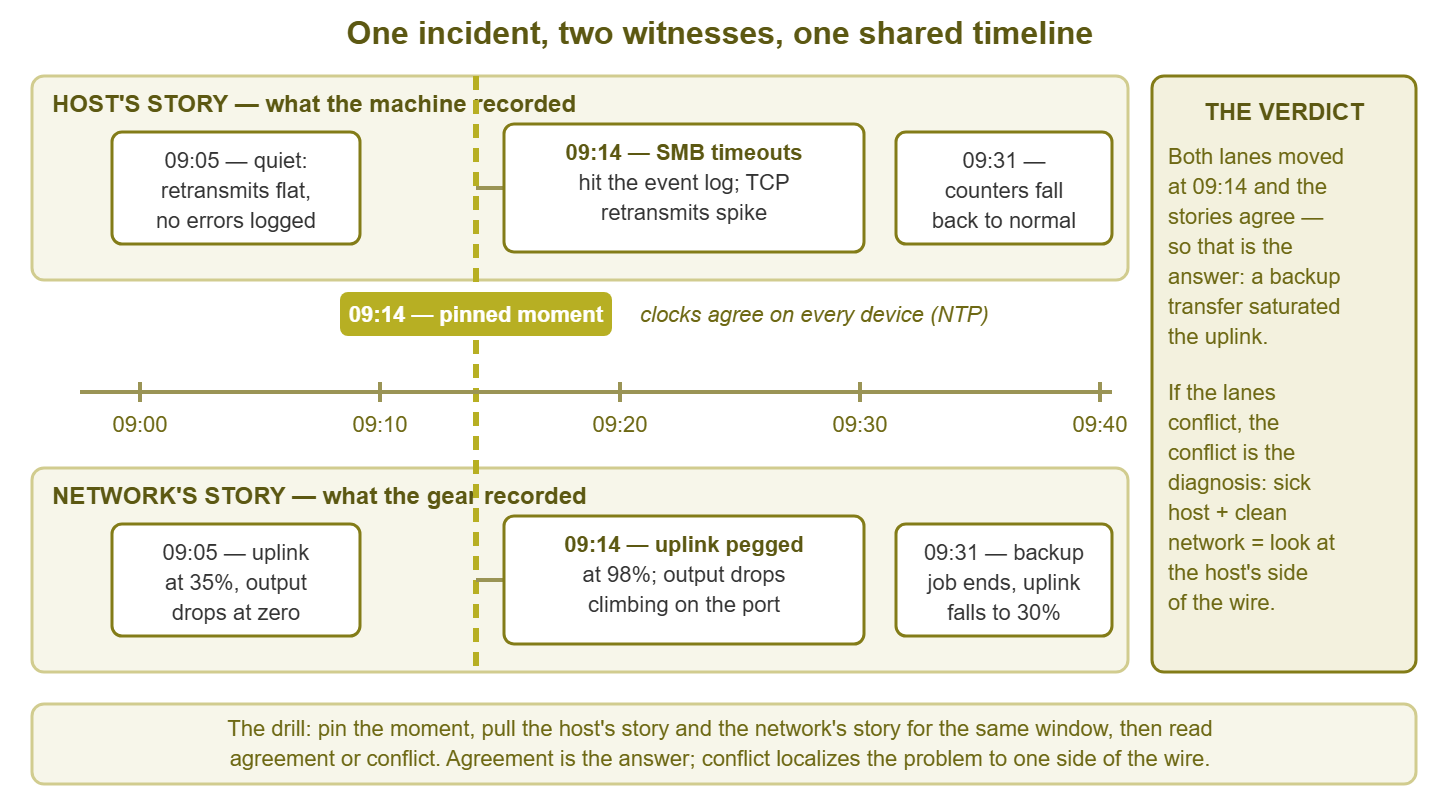
Figure 1: One incident, two witnesses. Pin the moment, line up both stories against the same clock, and the verdict falls out of where the lanes agree or conflict.
Step zero: agree on the clock
Correlation lives and dies on timestamps, so there is a precondition. Every device involved must agree what time it is, which is what NTP (Network Time Protocol) is for. Hosts, switches, and firewalls must all be synced to the same time source, ideally logging in the same time zone convention. If your switch's clock runs eleven minutes fast, its "clean" graph and the host's "disaster" log can describe the same moment while appearing to describe different ones. In that case, you will correlate fiction. Getting clocks and timestamps right is its own small art, covered in the syslog and log collection guides. For today, the one-line rule is: before trusting any cross-device timeline, verify the clocks agree, and note the offset if they do not.
The three-step correlation drill
Step 1: Pin the moment
Everything starts with a timestamp. You can get one from three places, in rising order of precision. First is a user report: "it froze around 9:15." Treat that as plus or minus ten minutes, because humans round. Next is an event-log entry: the host wrote a warning at 09:14:31. Treat that as ground truth. The guide to network-revealing event logs shows which entries to hunt for. Finally, there is a probe failure: your scheduled check failed at 09:15:02, and its log shows the last success at 09:10:02. That brackets the onset inside a five-minute window. Write the moment down, plus a window around it: fifteen minutes before to fifteen after is a good default. That window is now the frame for everything else.
Step 2: Pull the host's story for that window
Ask the machine what it experienced. The four host questions that pay off most often: Was TCP struggling? (retransmission counters climbing means the host was resending data it believed lost — the host-side smoke of packet loss). Were connections failing? (connection-failure counters, or refused/timed-out entries from applications). Was name resolution slow or failing? (DNS client events and lookup timing). And what was the machine itself doing? (a process suddenly moving gigabytes, a backup agent waking up, an update downloading — the host as suspect, not just witness). The counters that answer these live in the network performance counters worth collecting. The broader endpoint-as-sensor toolkit is in monitoring from the host.
Step 3: Pull the network's story for the same window
Now the outside witness. Three sources cover most incidents. First are switch port counters for the host's access port and the uplinks on its path: errors, discards, and utilization. A port counting CRC errors is confessing to a physical problem. Next are utilization graphs from your monitoring system: was any link on the path saturated during the window? Finally, there are firewall logs: were packets between these two addresses being dropped, and did a policy change land recently? Discipline matters here: pull data for the same window you framed in step 1, for the specific path between the complaining host and its destination. "The network was fine" as a general vibe is exactly the non-answer correlation exists to replace.
The optional third witness: history
Both stories get sharper with a baseline beside them. "Retransmits at 0.4% of segments" means little in isolation; "0.4% today versus 0.01% in the same window every other day this week" is a flare going up. Whenever your monitoring keeps history, pull the same window from yesterday and from a week ago and lay it under today's evidence. This is also the cheapest defense against the classic correlation trap — blaming something that is always true. That uplink at 80% during the slowdown looks damning until history shows it lives at 80% every day, including the days nobody complained. A witness statement that never changes convicts nobody.
Reading the verdict: agreement and conflict
Now lay the two stories side by side, and here is the insight that makes the whole method click: you win either way. If the stories agree, you have your answer with two independent confirmations. If they conflict — one witness saw trouble, the other saw calm — the conflict itself is the diagnosis, because it localizes the problem to one side of the wire. The classic patterns:
| Host's story | Network's story | Verdict |
|---|---|---|
| Retransmits climbing | Port error counters climbing on the same path | Agreement: physical path — cable, port, transceiver, duplex |
| Retransmits climbing | Local ports clean, but an uplink saturated | Agreement: congestion — something is eating the shared link |
| Retransmits climbing | Everything clean end to end | Conflict: loss is happening beyond your visibility — time to capture packets |
| DNS lookups timing out | Links and ports clean | Conflict: the resolver itself is sick, not the road to it |
| Connections refused at 09:14 | Firewall log shows new deny entries at 09:14 | Agreement: policy change, not flaky infrastructure |
| All clean | All clean — yet the app is still slow | Conflict with the complaint: the server or application is the bottleneck |
Notice the last row especially. "Both witnesses saw nothing" feels like failure, but it is one of the most valuable verdicts on the board. If the host's stack was healthy and every link was clean while users suffered, the time was being spent inside the far end — the server, the database, the application. Correlation did not find the culprit, but it eliminated two-thirds of the suspects with evidence.
One trap before you trust a double-clean verdict: make sure you pinned the right moment. Users report when they noticed, not when it started — "it froze at 9:15" often means it degraded from 8:50 and finally became unbearable. If both lanes look clean at your pinned moment, widen the window to an hour and skim for the earliest abnormal signal on either side. Then re-center the drill on that. Correlating the wrong minute produces a confident wrong answer, which is worse than no answer.
Case one: the morning file-share crawl
The complaint: every weekday around 9 AM, opening files from the main share takes forever; by 9:40 it is fine. The kind of soft, recurring misery that lives in tickets for months. The drill: a user report pins the window at roughly 08:50–09:30, and one complaining workstation plus the file server's path frame the investigation.
| Vantage | Evidence for 08:50–09:30 |
|---|---|
| Host | Event log records SMB (the Windows file-sharing protocol) latency warnings from 08:52; TCP retransmit counters on the workstation rise through the window and fall back after 09:30 |
| Network | Access ports clean, no errors — but the utilization graph for the server-room uplink is pinned near 100% from 08:30 to 09:35; the port-level traffic ranking shows one server sourcing most of it: the backup server |
Verdict: the stories agree — congestion, not breakage. The nightly backup job had grown until it no longer finished by morning. Its final and heaviest phase was overrunning into business hours and saturating the uplink everyone's file traffic shares. The fix was scheduling and throttling, not network hardware. And the verification was the same two graphs the next morning: retransmits flat, uplink comfortable, tickets silent. Without correlation this incident gets "solved" by rebooting the file server at 9:20 — right about when the backup ends on its own. The reboot gets the credit. For months.
Case two: the one-user mystery
The complaint: one accountant's applications hang several times a day. Nobody near her is affected, which is precisely why the ticket bounced. "The network is fine, it must be her machine" and "her machine images clean, it must be the network" can volley indefinitely. That is because both sides are checking the wrong evidence pool: everyone else's.
| Vantage | Evidence |
|---|---|
| Host | Her workstation's ratio of retransmitted to sent TCP segments is dramatically higher than an identical machine two desks away; the System event log shows brief link down/up flaps a few times a day |
| Network | Her specific access port's input error and CRC counters (checksum failures — the switch receiving mangled frames) climb steadily; the neighbors' ports show zero |
Verdict: both witnesses point at the same six feet of the world — the physical path between her NIC and her switch port. Frames were being corrupted in transit, the switch discarded them, her machine's TCP quietly resent everything, and every resend was a little hang. The culprit turned out to be the patch cable pinched under a desk leg (it is nearly always the cable, the jack, or the port). Replace, then verify: her error counter stops moving, her retransmit ratio drops to match her neighbor's. Note what closed this case. It was not a diagnostic genius, just per-port counters matched against per-host counters for the one affected user. Meanwhile, the aggregate view honestly reported that "the network" — on average — was fine.
Case three: the app-team standoff
The complaint: the line-of-business application freezes for everyone, several times an hour, and the app vendor's support has confidently blamed "network issues at your site." Now the stakes are political: someone is about to spend money on the wrong fix.
| Vantage | Evidence during three logged freezes |
|---|---|
| Host | Workstation retransmits flat; DNS instant; TCP connections to the app server open in a handful of milliseconds even mid-freeze; probe timing shows the connection succeeds fast — then the response to the actual request takes many seconds |
| Network | Path utilization low, all port counters clean, firewall passing traffic between clients and server with nothing dropped, during all three windows |
Verdict: both vantages clean while the freeze was actually happening — the double-clean conflict from the table. The wait lived inside the application tier, and one more measurement from the app server itself made it specific. The app server's own connections to its database stalled during each freeze. The problem was the database server, exactly the place "network issues" had deflected attention from.
And here is the diplomacy payoff, which is worth as much as the technical one. Nobody stood in a meeting saying "we proved it's your fault." The evidence went into a shared timeline: freeze at 10:41, here is the host's stack behavior, here is the path telemetry, here is where the time went. It was presented as our joint picture of the incident, a gift to the app team rather than ammunition against them. Correlation ends blame tennis not because someone finally wins the rally, but because both teams end up looking at the same scoreboard. The tone matters: evidence offered as shared truth gets acted on; evidence brandished as a verdict gets defended against.
When correlation says "go deeper"
Sometimes the drill ends in a genuine mystery: the host swears packets are vanishing, every counter on your gear pleads innocent. That is not a failure of the method — it is the method telling you the answer lives below the resolution of counters and logs. And the next tool is a packet capture, the network's equivalent of slow-motion replay. The correlation work you just did is what makes the capture cheap. You arrive knowing when to capture, where on the path, which hosts to filter for, and what hypothesis you are testing. You are not fishing in an ocean of packets. Bring both stories with you; the guide on when to reach for packet capture picks up exactly there. And when the symptom is specifically slowness rather than failure, the decision tree in troubleshooting high latency runs this same both-ends logic tuned for delay.
The both-ends dashboard: making this cheap
Everything above works as an after-the-fact investigation, but the drill has a fixed cost. During an incident you are juggling one console for host counters, another for switch graphs, a third for firewall logs, all while someone important hovers. The upgrade is embarrassingly simple: for each key server, put its host-side metrics and its network-side metrics on the same dashboard, side by side, before anything breaks. One panel: the server's retransmits, connection failures, DNS timing. Next to it: its access port's errors and utilization, and the uplink it depends on. Most monitoring systems can chart host and switch data on one page; the whole setup is minutes per server.
The payoff compounds. During an incident, correlation stops being an hour of tab-juggling and becomes a glance — two lanes, one timeline, verdict. Before incidents, the paired view teaches you what "normal" looks like for each pair, so the abnormal jumps out. Start with the three servers whose slowness generates the most tickets; you will wonder why the panels were ever separate.
The drill, as a checklist
Print this, or pin it wherever your incident notes live:
| Step | Do | Output |
|---|---|---|
| 0. Clock | Confirm hosts and gear agree on time (NTP); note any offset | A timeline you can trust |
| 1. Pin | Get the timestamp from a user report, event-log entry, or probe failure; frame a window around it | Incident moment ± 15 minutes |
| 2. Host | For the window: retransmits, connection failures, DNS timing, and what the machine itself was doing | The inside witness's statement |
| 3. Network | For the same window and the specific path: port errors, link utilization, firewall log entries | The outside witness's statement |
| 4. Verdict | Read agreement or conflict against the patterns table above | A side of the wire — or a proven "neither" |
| 5. Act | Fix, or hand off with both stories attached (capture, app team, vendor) | A next step with evidence, not vibes |
| 6. Verify | Re-pull both stories after the fix | Proof, and a closed ticket that stays closed |
Run the drill a few times and it stops feeling like a procedure and starts feeling like the only sane way to look at an incident. That means one clock, two witnesses, verdict. For the ingredients — which counters, which event IDs, which probes — the rest of the Windows-Side Network Monitoring guides supply the host side of every lane you just learned to read.
Put this into practice with SysPeep Monitor
The both-ends dashboard is easier when one system already has both ends. SysPeep Monitor collects host health over WMI and switch-port counters over SNMP. It puts them on the same dashboards and timelines with thresholds and alerts. Next incident, the two witness statements are already side by side. The free trial installs on one Windows machine and auto-discovers the rest.
Download Free TrialLearn About SysPeep - All Rights Reserved.