
Network Monitoring From the Host: What Windows Sees That Your NMS Doesn't
Picture a familiar afternoon. A ticket says "the network was slow for me around two o'clock." You check the monitoring system: the switches are green, the firewall is bored, the internet link is at 20% utilization. By every graph you own, nothing happened. And yet something absolutely happened — to one specific Windows machine, which experienced the whole thing in detail and, as it turns out, kept receipts.
Most network monitoring watches the middle of the network: switches, routers, firewalls. That view is essential, but it has a built-in limitation — the middle sees packets, not purposes. It can tell you that ten gigabytes moved between two addresses. It cannot tell you which program moved them, why, whether the transfer felt fast or agonizing, or how many pieces had to be sent twice. The machine at the end of the wire knows all of that, because it is the one doing the talking.
This guide makes the case for the Windows endpoint as a monitoring vantage point in its own right. You will see exactly which questions only the host can answer. You will meet the two ways of collecting its testimony — on-demand inspection and continuous collection. And you will learn the honest limits of the host's view, because it has those too.
In this guide
- Two vantage points, two kinds of truth
- Six things only the host knows
- Vantage mode one: on-demand inspection
- Vantage mode two: continuous collection
- The blind spots of the host view
- The both-ends discipline
- Quick reference: questions only the host can answer
Two vantage points, two kinds of truth
Every measurement in networking is taken from somewhere, and where you stand decides what you can see. A switch port sees frames go by: source, destination, size, count. A firewall sees connections form and die. These middle-of-the-network vantage points are wonderful at questions of volume and reachability — how much, from where, to where. (If the idea of vantage points is new to you, the guide on building a mental model of network visibility lays out the whole map.) This article lives in its "host" corner.
The endpoint stands somewhere different. The Windows machine is not watching the conversation — it is having the conversation. It knows the intent (which program asked to open a connection, to which name, resolved to which address). It knows the outcome (whether the connection succeeded, how long each step took, what had to be retried, and how the application experienced the result). Intent and outcome are precisely the two things a packet in the middle of the network does not carry. A switch sees an anonymous stream of traffic on port 443. The host sees "the backup agent is uploading to the offsite store, and every fourth segment is being resent."
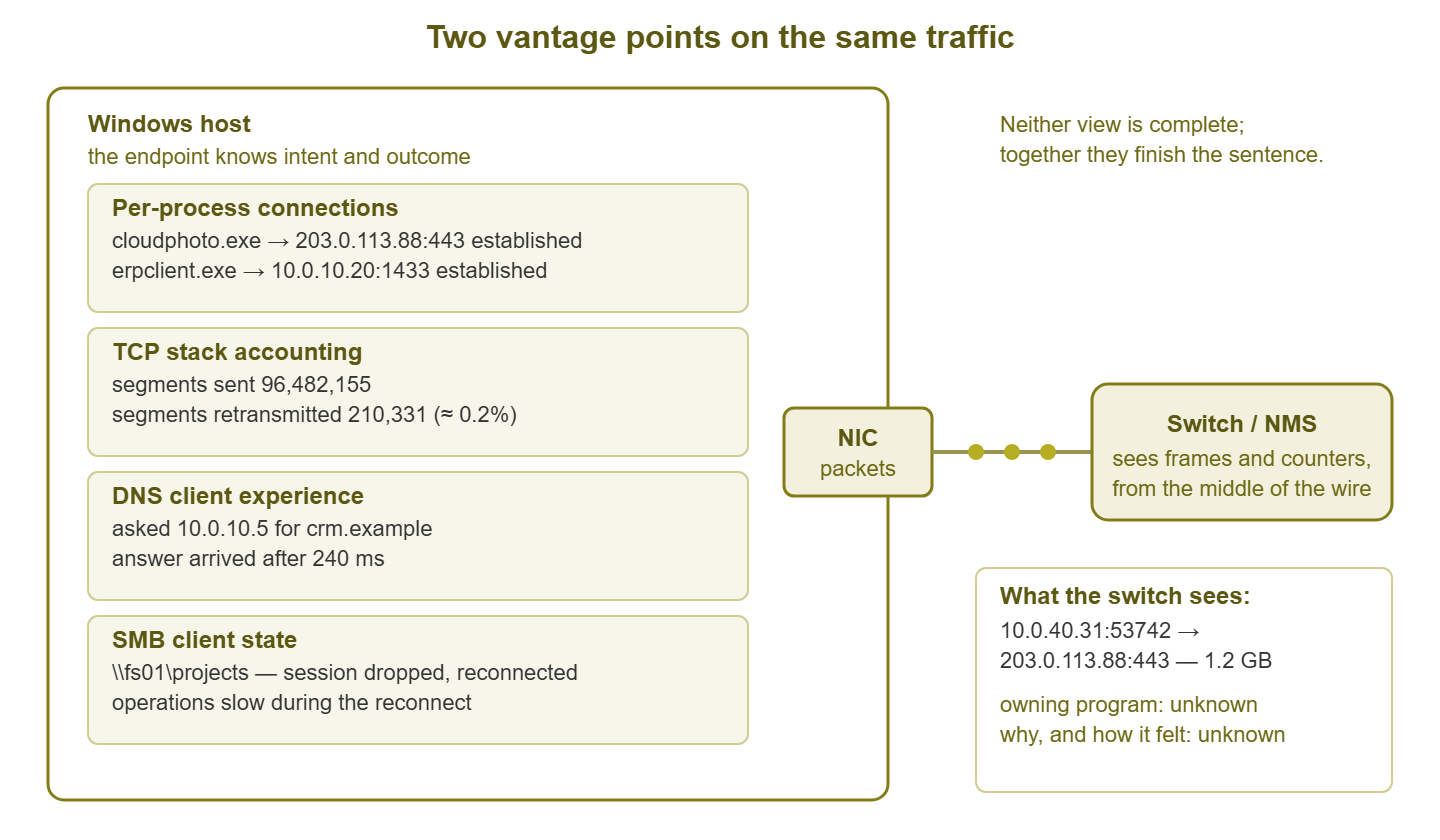
Figure 1: The same conversation from two seats. The host knows which program is talking, what it asked for, and how it went. The switch knows addresses and byte counts — and nothing else.
Neither vantage point replaces the other. But most small networks have monitoring aimed only at the middle, which means half the story is going unrecorded on machines you already own. Let us look at what that half contains.
Six things only the host knows
1. Which program owns that connection
Every TCP or UDP conversation on a Windows machine belongs to a process. The operating system tracks this pairing in real time — socket to process ID to executable name. No device out on the network can reconstruct it, because the packets themselves carry no hint of it. This is the single most valuable fact in the host's possession. The classic win: an office's internet link pegs at 100% every day around lunch. The switch can only say that most of the traffic comes from one desktop's IP address. On the desktop itself, one command lists the connections with their owning programs. And there it is — a cloud photo tool cheerfully re-uploading a home photo library over the office link. Mystery solved by a process name, in about forty seconds, with no packet capture and no interrogation of the user.
2. The TCP stack's own accounting
When a network drops or mangles a packet, TCP quietly resends it. The application never hears about it; the user just feels slowness. Here is the important part: the sending host knows exactly what it resent, because it did the resending. Windows keeps running totals — segments sent, segments retransmitted, connections failed, connections reset — in the TCP stack itself. That makes the host's retransmission figures ground truth, not an estimate. Devices in the middle of the network can only infer loss by sampling or by watching sequence numbers fly past; the endpoint has the actual ledger. When you need to prove that a path is lossy — or prove that it is not — the stack's own numbers are the strongest evidence you can bring. They pair beautifully with the techniques in measuring packet loss.
3. The name-resolution experience
Before nearly every connection comes a DNS lookup, and DNS trouble wears a network-trouble costume: pages that hang before loading, apps that stall on launch, everything "slow" while every bandwidth graph stays flat. The host knows what actually happened. It knows which DNS server it really asked, not which one you think it uses. Those differ more often than anyone likes. It knows whether the answer came from cache or the wire and how long it took. It knows whether the first server timed out before a second one saved the day silently. A machine that waits two seconds for every lookup feels broken in a way no switch counter will ever show, and only the machine itself can testify to it.
4. File shares, from the client's seat
"The file share is slow" is one of the most common complaints in Windows environments, and the evidence lives almost entirely on the client. The SMB client — the Windows component that speaks the file-sharing protocol — knows which server it is attached to. It knows whether the session has been dropping and reconnecting, and how long file operations are taking. It knows whether it negotiated the fast modern dialect of the protocol or fell back to something slower. From the switch, an unhappy SMB session and a happy one look like the same port 445 traffic. From the client's seat, the difference is written down.
5. The security inventory: who is listening, who is calling out
Every host maintains, at all times, a complete list of its listening ports (services waiting for inbound connections) and its outbound connections. Reading that list is inventorying reality rather than assumption — and reality is reliably surprising. You might find a "web server" that is also listening on a remote-desktop port nobody opened deliberately. Or a workstation might have a steady outbound connection to an address no business process explains. Or a database port might be exposed on every interface instead of just the internal one. None of this is visible from the middle of the network until traffic actually flows, and some of it matters precisely before traffic flows. The host's socket table is the cheapest security audit you will ever run.
6. How, exactly, the connection failed
To a user, every failure is "it doesn't work." To the host, failures come in usefully different flavors. A connection that was refused means the packet arrived and the machine at the far end said "nothing is listening on that port." The network is fine; the service is down or the port is wrong. A connection that timed out means nothing came back at all — a firewall ate it, the route is broken, or the host is gone. A connection that was reset mid-conversation means someone hung up on an established call — often a crashing application or a security device cutting in. Each flavor points at a different culprit, the host records which one occurred, and knowing it converts an hour of guessing into a minute of looking.
Vantage mode one: on-demand inspection
There are two ways to collect the host's testimony. The first is the one every admin should have in muscle memory: walking up to the machine (or remoting in) and asking it questions right now. The classic tool is netstat, which prints the socket table. Run as administrator with the right flags, it names the owning program too:
netstat -nob

Active Connections

  Proto  Local Address        Foreign Address       State        PID
  TCP    10.0.40.31:53742     203.0.113.88:443      ESTABLISHED  4816
 [cloudphoto.exe]
  TCP    10.0.40.31:53794     10.0.10.5:445         ESTABLISHED  4
 Can not obtain ownership information
Reading it: the first connection belongs to process 4816, and the bracketed line beneath names the executable — there is the lunchtime photo uploader from earlier. The second goes to port 445 (SMB, the file-sharing port) and belongs to PID 4, which is always the Windows kernel itself. System-owned connections show "can not obtain ownership information" instead of a friendly name, and SMB is the usual reason you will see it. Here are the flags. The flag -n shows raw numbers instead of resolving names (faster, and honest). The flag -o adds the process ID. The flag -b adds the executable name and is the part that requires an elevated prompt.
The modern PowerShell equivalent is friendlier to filtering and scripting, and joins the process name in one step:
Get-NetTCPConnection -State Established |
  Select-Object LocalAddress, LocalPort, RemoteAddress, RemotePort,
    @{n='Process'; e={ (Get-Process -Id $_.OwningProcess).ProcessName }}

LocalAddress LocalPort RemoteAddress RemotePort Process
------------ --------- ------------- ---------- -------
10.0.40.31       53742 203.0.113.88         443 cloudphoto
10.0.40.31       53794 10.0.10.5            445 System
10.0.40.31       53810 10.0.10.20          1433 erpclient
The same tool answers the security-inventory question from earlier. Swap the filter to -State Listen and you get the machine's complete list of waiting doors. That means every port something is prepared to accept connections on, each with its owning process. Read it slowly the first time. On almost every machine, at least one line will make you say "wait, why is that listening?", and that reaction is the audit working.
And the TCP stack's ledger — the ground-truth retransmission accounting from earlier — is one command away:
netstat -s

TCP Statistics for IPv4

  Active Opens                    = 918274
  Failed Connection Attempts      = 1489
  Reset Connections               = 20443
  Segments Sent                   = 96482155
  Segments Retransmitted          = 210331
Those two bold-worthy lines at the bottom say this machine has resent about 0.2% of everything it ever sent since boot — a healthy figure. If you ran this during a complaint window and saw the retransmitted number climbing fast against the sent number, you would be holding stack-level proof that something on the path is losing data.
Tip: netstat -nob needs an administrator prompt, and the numbers from netstat -s are running totals since the machine booted — a big lifetime number is normal. What matters is how fast a number grows while the problem is happening. Run it twice a minute apart and subtract.
Vantage mode two: continuous collection
On-demand inspection has one flaw: you have to be there. The complaint is "it was slow at two o'clock," and by the time you arrive at four, the evidence has often evaporated. The socket table shows what is connected now; the lunchtime uploader is long gone. The fix is the second mode — having something collect the host's numbers continuously, so history exists when you need it.
Windows was built for this. The operating system continuously publishes thousands of metrics as performance counters — including per-interface traffic, error counts, and the TCP statistics you just met. It exposes nearly everything it knows through WMI (Windows Management Instrumentation), a query service that answers questions locally or across the network. A monitoring system, or even a scheduled script, can read these on a cycle and keep the history. It can do this every five minutes, forever, with no human required. That turns "it was slow at two" from an unsolvable mystery into a lookup — you scroll the chart to two o'clock and read what the machine recorded.
The two collection channels each get a full guide in this topic. The guide to the network performance counters worth collecting covers which of the thousands of counters actually earn a place in your collection. And WMI and CIM for network data covers querying them remotely and safely at fleet scale. Together they are how the host's testimony becomes monitoring rather than archaeology.
The blind spots of the host view
A vantage point this good deserves an honest accounting of what it cannot do, because the host view has three real limits.
It sees only its own conversations. The host knows everything about traffic it sends and receives, and nothing about anyone else's. It cannot tell you the switch uplink is saturated, that two other machines are flooding each other, or that the printer VLAN is having one of its moods. Endpoint data describes one seat in the theater, not the theater. For network-wide questions you still need the middle-of-network view your switches and flow data provide.
A compromised endpoint can lie. The host's testimony is only as trustworthy as the host. Malware with administrator rights can hide processes and connections from the very tools you would use to look for them. The socket table you print is the one the operating system chooses to show. This is why security investigations compare the host's story against the network's story. The switch and firewall have no reason to cover for an infected machine. Host data is evidence, not gospel, and disagreement between the two views is itself a finding — sometimes the most important one.
Collection is a guest on a working machine. Reading counters and running WMI queries costs a little CPU on the machine being watched. The cost is small when done sensibly — sane intervals, narrow queries. But a badly configured collector hammering a server every second becomes a tiny denial-of-service you installed on purpose. Etiquette matters; the WMI guide in this topic covers the polite way.
The both-ends discipline
Here is the habit that separates calm troubleshooting from the eternal blame game. Treat the host view and the network view as two halves of one sentence, and refuse to draw conclusions until you have read both. The switch says ten gigabytes moved; the host says which program moved them and how it felt. The host says one in twenty segments needed resending; the switch's error counters say which port was mangling frames. The user says "the network is slow." The host says its DNS server takes two seconds to answer. The network view says the DNS server's switch port is fine. Now you know the problem is on the server, not the path. And the network team and server team can stop glaring at each other.
Each half alone invites a wrong guess. Together they usually leave only one explanation standing. The craft of lining the two up — matching timestamps, matching conversations, resolving contradictions — is its own skill. It gets a dedicated guide in this topic: correlating host-side and network-side data.
Quick reference: questions only the host can answer
| Question | Why the network view can't answer it | Where the host keeps the answer |
|---|---|---|
| Which program is using the bandwidth? | Packets don't carry process names | Socket table with owning process (netstat -nob, Get-NetTCPConnection) |
| Is data actually being lost on this path? | Middle boxes sample and infer | TCP stack retransmit totals (netstat -s, TCP counters) |
| Why does everything feel slow to launch? | DNS delay moves almost no bytes | DNS client: which server was asked, how long it took |
| Why did the file copy die? | SMB sessions look like generic port 445 traffic | SMB client session state and reconnect history |
| What is listening on this machine? Who is it calling? | Invisible until traffic flows | Listening-socket and outbound-connection inventory |
| Did the connection fail because of the network or the service? | A refused and a filtered connection look similar from outside | Failure flavor: refused vs. timed out vs. reset |
Where to go next
The endpoint has been a monitoring sensor all along — fully instrumented, already deployed, and mostly unread. Once you start treating Windows machines as vantage points rather than just victims, a whole class of "the graphs say nothing happened" mysteries becomes solvable. That is because you finally have testimony from the seat where the problem was experienced.
From here, the natural path through this topic is to learn which performance counters to collect. Then learn how to query them across the fleet with WMI. Keep the rest of the Windows-Side Network Monitoring guides handy for event logs, PowerShell probes, and the host-side gremlins that impersonate network problems.
Put this into practice with SysPeep Monitor
The host view and the network view are two halves of one picture, and SysPeep Monitor is built to hold both. It discovers the switches and firewalls on your network. It collects health and performance data from your Windows machines over WMI — the same host-side evidence this guide describes. That data goes onto one dashboard with alerting that stays quiet until something matters. The free trial installs on a single Windows machine in minutes.
Download Free TrialLearn About SysPeep - All Rights Reserved.