
Handover-Ready Monitoring: Config, Credentials, and the Why Behind Every Check
Imagine handing your monitoring system to a stranger with one document and no conversation. Not a colleague who has watched you work for a year; a competent administrator who has never seen your network, reading a file you wrote. Could they tell what is monitored and why? Could they find the SNMP community string without asking? Could they say why the file server disk warning is at 91 per cent rather than 90? If any answer is "they would have to ask me", the monitoring is not handover-ready. The gap is not in the tool but in what was never written down.
This guide is about closing that gap with the smallest document that works. The bus factor of your monitoring is the test that shows where the gaps are. This one is the writing. It covers the four things a monitoring system needs on paper, a README template you can copy, and a one-page map. It also covers the rule that keeps it current after the first enthusiastic afternoon wears off.
By the end you will have a service-to-checks map and a threshold table with a "why this number" column. You will have a credential section that contains no credentials and a map of the monitoring itself. And you will have a README skeleton ready to fill in.
In this guide
- Handover-ready, defined
- The four things to write down
- What is monitored, and why
- Thresholds and their reasons
- Where credentials live
- The map of the monitoring itself
- The README template
- Keeping it current
- The checklist
- Where to go next
Handover-ready, defined
Handover-ready means someone could take the monitoring over from a document rather than from you. The document does not have to be long or beautiful. It has to answer the questions the next person will ask in their first week, without a phone call. It has to answer them in the order they will ask them. That is the whole standard, and it is stricter than "we have documentation", because most documentation answers the questions the author felt like answering.
The word "document" is doing careful work here. It means a written thing that exists outside your head and outside the monitoring tool. The tool's own configuration is not documentation, because it tells you what is set and never why. A screenshot of the console is not documentation. The README below is, and so is the one-page map, and between them they are enough for most monitoring systems. Minimum viable documentation makes the same argument for the network as a whole; this is the monitoring-shaped version.
Handover-ready is also the standard that makes your own life easier. The next person to read the README is usually you, six months from now, wondering why the branch VPN check has a fifteen-minute delay. Documentation written for a stranger turns out to be written for your future self, who is a stranger with your password.
The four things to write down
A monitoring system needs four things on paper, and only four, to be handover-ready. Each answers a question that arrives at a predictable moment in the next person's first week.
- What is monitored and why answers the day-one question: "what does this thing watch?" A service-to-checks map with one sentence per service.
- Thresholds and their reasons answers the first-false-alarm question: "can I change this number?" A table with a "why this number" column.
- Where credentials live answers the first-new-device question: "what is the SNMP string?" A pointer to a credential store, never the credentials themselves.
- The map of the monitoring itself answers the first-outage question: "what talks to what, and where do alerts go?" A one-page diagram.
Write them in that order, because that is the order in which their absence hurts. Without the service map a newcomer cannot do anything. Without threshold reasons they will do something wrong. Without the credential pointer they will do nothing for a day. Without the map they will be fine until the server dies, and then will not be.
What is monitored, and why
The service-to-checks map is a table with one row per service the business cares about. Each row has the checks that watch the service and one sentence on why it matters. A service here means something a user would name if it broke: email, the shared drive, the till system. A check is one thing the monitoring measures: a ping, a disk percentage, a port that should be open. The map connects the two, and it is the first thing a newcomer should read, because it turns four hundred checks into twelve reasons.
| Service | Checks that watch it | Why it matters (one sentence) | Who cares |
|---|---|---|---|
| Mail server ping, SMTP port, mail queue length, mailbox disk | Orders and supplier invoices arrive by email; an hour down is missed orders. | Sales, finance | |
| Shared drive | File server ping, SMB port, volume D: free space, backup job status | Every department's working files; full disk stops everyone saving. | All staff |
| Internet connection | Firewall ping, ISP gateway ping, external DNS lookup, WAN interface utilisation | Cloud applications, email delivery, and the VPN all depend on it. | All staff |
| Warehouse Wi-Fi | Access point ping (each), controller ping, warehouse switch uplink utilisation | Handheld scanners stop working; goods cannot be received or picked. | Warehouse |
| Till system | Till server ping, application port, database service, CPU | Shop cannot take payment while it is down. | Retail manager |
The "why it matters" sentence is the part people skip, and it is the part that makes the table worth reading. Without it the table is an inventory. With it, the newcomer knows which red tile to look at first when three go red together, and which alert can wait until morning. Service-based monitoring covers the design behind grouping checks by service; the table is the written record of that design.
Seed the table from the tool rather than from memory, because memory forgets the boring checks. Most products can export a list of devices and checks, and most monitoring databases can be queried for one. The shape is below. The names will differ, and the product documentation has the real ones. Query a copy of the database if you can.
-- Illustrative: every check, grouped the way the service map needs it
SELECT g.group_name AS service, d.device_name, c.check_name,
       c.warning_threshold, c.critical_threshold
FROM checks c
JOIN devices d ON c.device_id = d.id
JOIN device_groups g ON d.group_id = g.id
ORDER BY g.group_name, d.device_name, c.check_name;
Walk down the result beside the table. Every check that belongs to no service is either a gap in the table or a check that should not exist. Both are worth knowing. (Most monitoring systems have a few of the second kind. They were important once.)
Thresholds and their reasons
The threshold table lists every check whose threshold is not the default, with the value and the reason it was chosen. A threshold is the line a measurement crosses to become an alert. Examples are disk at 90 per cent, response time over 500 milliseconds, or five failed pings in a row. Defaults need no explanation because they are nobody's decision. Every non-default number was somebody's decision. The reason is what the next person needs when the alert fires at three in the morning and they are wondering whether to loosen it.
The column that matters is "why this number", and it is the most valuable column you will ever write. Not "what the number is", which the tool already knows, and not "who set it", which is secondary. Why. "Backup staging fills to 89 per cent nightly and drains by six; 91 catches real growth without a nightly false alarm." One sentence like that saves an hour of investigation. It stops the next person setting it back to 90 and wondering why they get an alert every night. Threshold tuning covers how to pick the number; this table is where you write down that you did.
| Device and check | Warning / critical | Default was | Why this number | Set by |
|---|---|---|---|---|
| file01, volume D: free space | 91% / 96% | 80% / 90% | Backup staging fills to 89% nightly and drains by 06:00; 91% catches real growth without a nightly alarm. | Initials, date |
| wh-core, uplink Gi1/0/48 utilisation | 60% / 75% | 80% / 90% | Uplink is oversubscribed on purpose; scanner traffic degrades above 60% long before it saturates. | Initials, date |
| branch-vpn, tunnel down | 15 min before alert | immediate | ISP re-keys the tunnel nightly and it recovers in under ten minutes; alerting sooner is pure noise. | Initials, date |
| till-srv, CPU | 85% / 95% | 80% / 90% | End-of-day report runs CPU to 82% for twenty minutes; that is normal, not an incident. | Initials, date |
At Northgate Retail the CPU warning on the till server had been 73 per cent for as long as anyone could remember. Three successive administrators noticed it, asked, and were told "that is what it has always been". They left it alone, because a number that specific must have a reason. It had been set by the first administrator on the afternoon she was testing whether the alert email worked. That day the server was idling at 72, and she had meant to put the warning back. Three administrators had faithfully protected a test. When the fourth raised it to 85 and nothing happened, that was the first thing anyone had learned about it.
Where credentials live
The credential section of the README contains no credentials. It says which credential store holds them, which entry each one is under, and who has access. A credential store is a password manager or vault that keeps secrets encrypted and grants access per person or group. A shared spreadsheet is not one, and neither is a text file called passwords.txt, however cleverly it is named. The README is the map to the store. It is never the store.
This matters because the README will be copied, emailed, printed, and left in a shared folder. And a document that travels that freely cannot contain a community string. The store can be given to the next person without being given to everyone. Discovery credentials covers which credentials a monitoring system needs and how to scope them. The handover question is only whether someone else can find and open them.
Write the pointer like a library reference: store name, folder, entry name, and the group that has access. "SNMP read-only community for switches: store ITVault, folder Monitoring, entry snmp-ro-switches; access: the on-call group." A newcomer in the on-call group can now find every secret the monitoring uses without asking. And one who is not cannot, which is exactly right.
Check that at least two people can open the store today. A store that only you can unlock has moved the bus factor from the README to the vault. That is progress of a sort, but not the kind you were after.
The map of the monitoring itself
The map of the monitoring is a one-page diagram of the monitoring system's own parts. It shows the server, its probes, its database, where the backup goes, how alerts leave, and where credentials come from. It is not a network diagram. Network diagrams show what the monitoring watches; this map shows the monitoring. The two get confused constantly, which is why the monitoring server is so often the one machine missing from the network diagram.
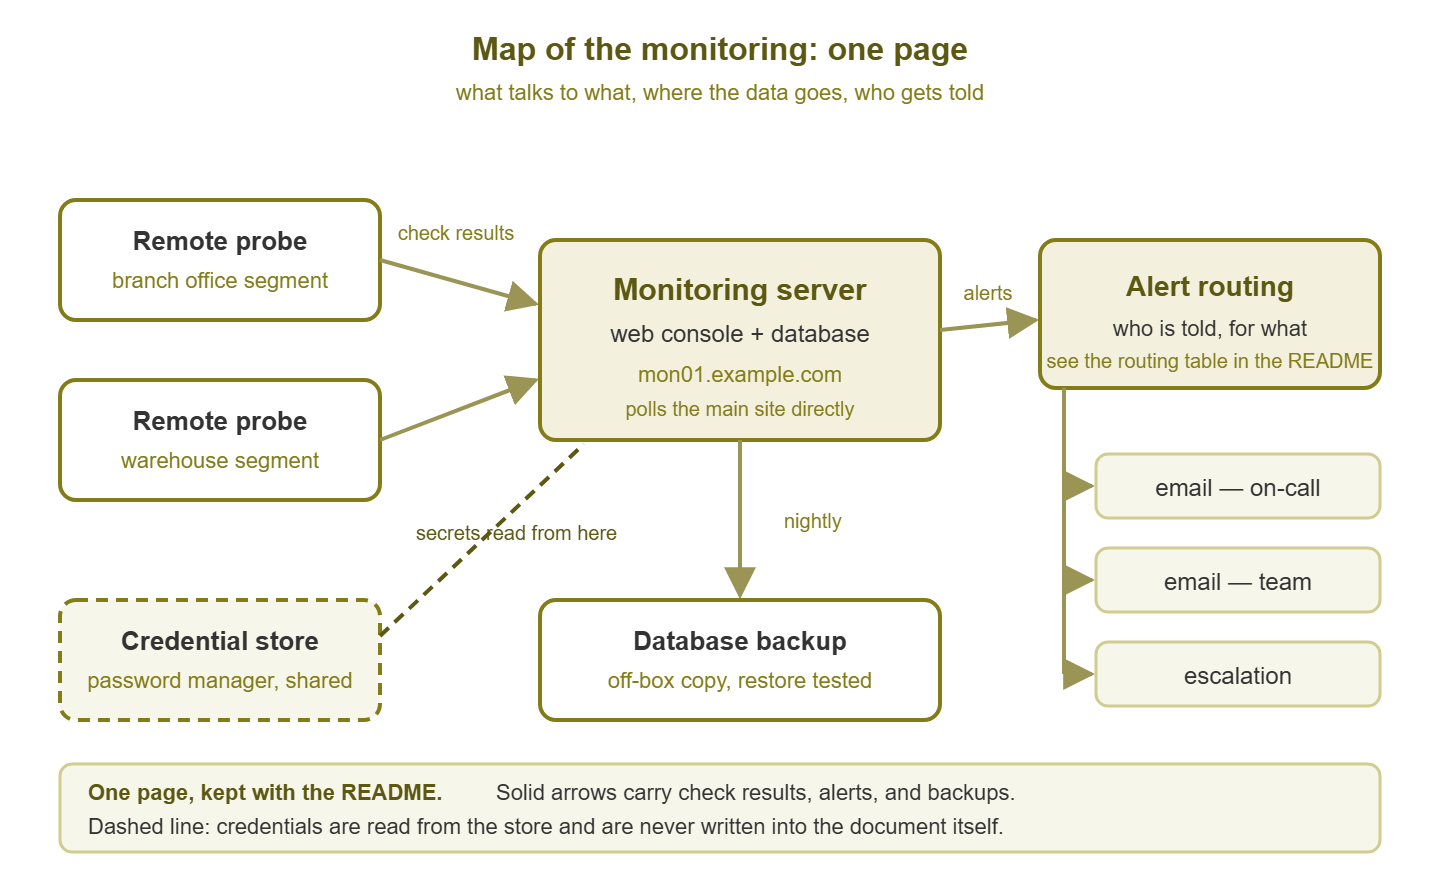
Figure 1: The map of the monitoring on one page: server, probes, database backup, alert paths, and the credential store the server reads from. Solid arrows carry data and alerts; the dashed line is a pointer, not a secret.
The map earns its place during the first outage of the monitoring itself. When the console stops loading, the map says whether a probe is still collecting. It says where the database backup is and which mail relay the alerts use. So the newcomer can tell "the server is down" from "the alerts are down" from "the network between them is down". Those are three different repairs, and without the map they all look the same: a quiet console. Probes and collectors explains the parts; the map records which ones you have.
Fill in the real names: the actual server, backup path, mail relay, and the three real notification addresses. A map with placeholder names is a template, and the newcomer does not need a template, they need yours. One page is the limit, and it is a generous one.
Two commands help you draw it honestly, because the map should show what runs on the server, not what you remember installing. List the running services and the enabled scheduled tasks. The backup job, the mail client, and the thing a previous admin added are all in there somewhere.
Get-Service | Where-Object { $_.Status -eq 'Running' } |
    Select-Object Name, DisplayName | Sort-Object Name

Get-ScheduledTask | Where-Object { $_.State -ne 'Disabled' } |
    Select-Object TaskName, TaskPath | Sort-Object TaskPath
Anything in those lists that is not on the map is either irrelevant or a dependency you forgot. Decide which, and draw the second kind.
The README template
The README is a single text file that holds the four things and the small extras that make them usable. Those extras are an owner, a change log, and a review date. Copy the skeleton, keep the headings, and fill it in over a week of afternoons. It is plain text on purpose. Plain text opens on any machine, survives every migration, and sits happily in version control next to the configuration it describes.
MONITORING SYSTEM README                      Review date: ____-__-__

1. WHAT THIS IS
   Product: ____________   Server: mon01.example.com
   Console: https://mon01.example.com/
   Owner: ____________     Deputy: ____________   On-call group: ____________

2. THE MAP
   See monitoring-map.svg (one page). Parts: server, probes (list),
   database (type), backup target, mail relay, credential store.

3. WHAT IS MONITORED AND WHY
   Service        Checks                              Why it matters
   ____________   ____________________________________ ______________________

4. THRESHOLDS THAT ARE NOT DEFAULTS
   Device / check          Warn / crit   Default   Why this number   Set by
   ______________________  ___________   _______   _______________   ______

5. CREDENTIALS
   All secrets are in store ________, folder "Monitoring".
   Access: on-call group. Never write a secret in this file.
   SNMP read-only (switches):   entry ____________
   WMI service account:         entry ____________
   SSH key (firewalls):         entry ____________

6. ALERT ROUTING
   Alert group         First notified      After 15 min      After 60 min
   ________________    ________________    ______________    ______________

7. BACKUP AND RESTORE
   Database: ________. Backed up nightly at __:__ to ____________________.
   Restore procedure: restore-procedure.txt. Last restore test: ____-__-__

8. MAINTENANCE WINDOWS AND EXCLUSIONS
   Window or excluded device        Why
   ______________________________   ________________________________

9. KNOWN ISSUES
   - ________________________________________________

10. CHANGE LOG (newest first)
   Date         Who    What changed                    Why
   ____-__-__   ___    ____________________________    __________________
Sections three to six are the four things. Sections one, two, and seven are the map and the pointers to it. Sections eight to ten are the memory. They hold the windows and exclusions that exist for a reason, the things known to be odd, and the record of every change. A README with all ten headings and half the blanks filled is already more than most monitoring systems have ever had.
Keeping it current
One rule keeps the README alive: no change to the monitoring without a line in the README. Add a device, add a line. Change a threshold, update the row and its "why". Change who is notified, update the routing table. The rule is simple enough to follow at eleven at night. It is strict enough that the document never drifts more than one change behind the tool. The README dies the first time someone says "I'll update it tomorrow", so the rule is "before you close the console".
The rule works best when the README lives next to the configuration in version control. That way, a change to one is visibly missing a change to the other. Version-controlling checks covers putting check definitions under version control. The guide to reproducible monitoring setups covers rebuilding from what is checked in. The README belongs in the same repository, so that the history of the reasons sits beside the history of the numbers. If your product's configuration cannot be exported as text, the README is the version control, and its change log is the history.
Treat the monitoring's own configuration as one worth backing up, for the same reasons switch configurations are. Why back up configs makes the case for network devices, and every argument applies to the one device whose configuration describes all the others.
Tip: put the review date on the first line of the README and set a calendar reminder for it. On that day, read the file top to bottom against the live console and fix every line that disagrees. It takes an hour a quarter. A README with a review date in the past is one a newcomer will correctly distrust. A distrusted README is read once and never again.
The checklist
Use this to decide whether the monitoring is handover-ready. It is not ready until every line is a yes.
- A README exists, in plain text, with an owner, a deputy, and a review date on the first line.
- The service-to-checks map has a row for every service the business would name, with a "why it matters" sentence on each.
- Every check in the tool belongs to a row in the service map, or has been removed.
- Every non-default threshold has a row in the threshold table with a "why this number" entry.
- The credentials section names the store, the folder, and each entry, and contains no secret.
- At least two people can open the credential store today.
- The map of the monitoring exists on one page with real host names, the real backup target, and the real notification addresses.
- The alert routing table matches the routing configured in the tool.
- Every maintenance window and deliberate exclusion has a written reason.
- The change log has an entry for the most recent change to the monitoring.
- The README is stored with the network documentation, and in version control where possible, not only on your laptop.
- The review date is in the future and on a calendar.
Where to go next
Handover-ready is a document, not a project. Four things on paper, a one-page map, a README with ten headings, and a rule that every change gets a line. The reasons behind the numbers are the part no tool can hold for you and the part the next person will thank you for most. Write the four things in order, and the monitoring stops being something only you can run.
If the reasons are in a colleague's head rather than yours, extracting tribal knowledge is the interview that gets them out before the colleague leaves. Onboarding the next admin is the week that proves the README works, and the handover pack adds the remaining items. All of them are part of Making Monitoring Survive You: Documentation and Bus Factor.
Put this into practice with SysPeep Monitor
A README is easier to write when the monitoring has fewer moving parts to describe. SysPeep Monitor runs as one central Windows service with optional remote probes. It keeps devices, checks, dependencies, and alert rules in a single web console. It stores everything in SQLite, MySQL/MariaDB, or SQL Server. So section seven of the README is a database you can back up and restore. For exporting the list of checks to seed the service map, check the product documentation. The free trial is at /download/.
Download Free TrialLearn About SysPeep - All Rights Reserved.