
Finding the Slow Hop: A Hop-by-Hop Localization Playbook
The ticket says the CRM is slow. You run one traceroute from your desk, and there it is: hop six, ugly numbers, a couple of asterisks. Case closed? Not so fast. Half the time that hop is completely innocent, and the real trouble lives somewhere a single trace from a single desk can never show you. Convicting the wrong hop wastes an afternoon; convicting a provider's innocent router wastes an afternoon and your credibility on the support line.
Localization is the discipline of turning "it's slow" into a sentence with an address in it: the trouble begins here, on this segment, and that segment belongs to this owner. This guide is a repeatable playbook for getting to that sentence. It covers what to prove before you trace anything and how to run the same test from several vantage points. It covers how to read where the problems overlap and how to dodge the famous false positive that fools every newcomer. And it covers how to deliver a verdict — your LAN, your WAN circuit, or somebody's provider network.
One thing this guide is not: a tool tutorial. How traceroute builds its hop list is covered in reading traceroute output. The continuous version of the same test lives in MTR path testing. Here we assume you can run the tools and concentrate on the workflow that makes their output mean something.
In this guide
- Step zero: prove the symptom end to end
- One trace lies, three traces triangulate
- Choosing your vantage points
- Running the tests without fooling yourself
- Reading the results: where does trouble begin?
- The hop that only looks broken
- The verdict: LAN, WAN circuit, or provider
- A worked example, ticket to verdict
- When the evidence will not converge
Step zero: prove the symptom end to end
The urge to trace immediately is strong. Resist it for five minutes, because a trace without a measured symptom is just fishing. You will find something odd-looking, and then you will spend the day explaining a quirk instead of fixing a problem. First, turn the complaint into numbers, measured from a machine that actually feels the pain.
A sustained ping toward the destination does most of the work. Let it run a hundred packets or a few minutes, then read the summary:
$ ping -c 100 203.0.113.30
100 packets transmitted, 96 received, 4% packet loss
rtt min/avg/max/mdev = 84.1/187.3/291.0/44.9 ms

# Register entry for this destination says:
#   normal latency 80-95 ms, zero loss
# Symptom confirmed: latency roughly doubled, loss appeared
Now the complaint has a shape: four percent loss and about twice the usual latency, from the sales segment, starting mid-morning. The comparison line matters as much as the measurement. It comes from the path register you built in building a path baseline. That comparison is what separates "this is broken" from "this is Tuesday." If you have no baseline, you can still localize, but every judgment call gets harder. (What actually hides inside that round-trip number is its own story, told in the anatomy of a round trip.)
While the ping runs, scope the blast radius, because scope splits the problem before you trace a single hop. Is it one destination or every destination? One user, one segment, or the whole building? A glance at your monitoring dashboard answers this faster than any command. Everything slow for everyone points near you — an edge device or a saturated circuit. One destination slow for everyone points down that destination's path. One user slow points at a desk, not a backbone.
And if the ping comes back clean — latency in range, no loss — be honest about what that means. In that case, the network path may not be your culprit at all. Slow applications on a healthy path are an application-layer conversation. Path analysis is a sharp tool; step zero is checking you are holding the right one.
One trace lies, three traces triangulate
A single traceroute has two built-in weaknesses. First, it shows one road from one door: the path from your machine. That may share almost nothing with the path from the users who are complaining. Second, its per-hop numbers are answers routers give as a low-priority favor. That means individual hops can look terrible while forwarding real traffic perfectly — more on that trap shortly.
The fix for both weaknesses is the same: run the identical test from several starting points and compare notes. Think of three coworkers who all arrived late — one drives in from the north, one from the south, one from the east. Their routes share exactly one thing: the bridge by the office. If all three complain about the same jammed bridge, you know where the problem is without inspecting every mile of every route. Paths work the same way: a real fault lives where the troubled portions of independent paths overlap, and it cannot live on any segment some clean path passed through.
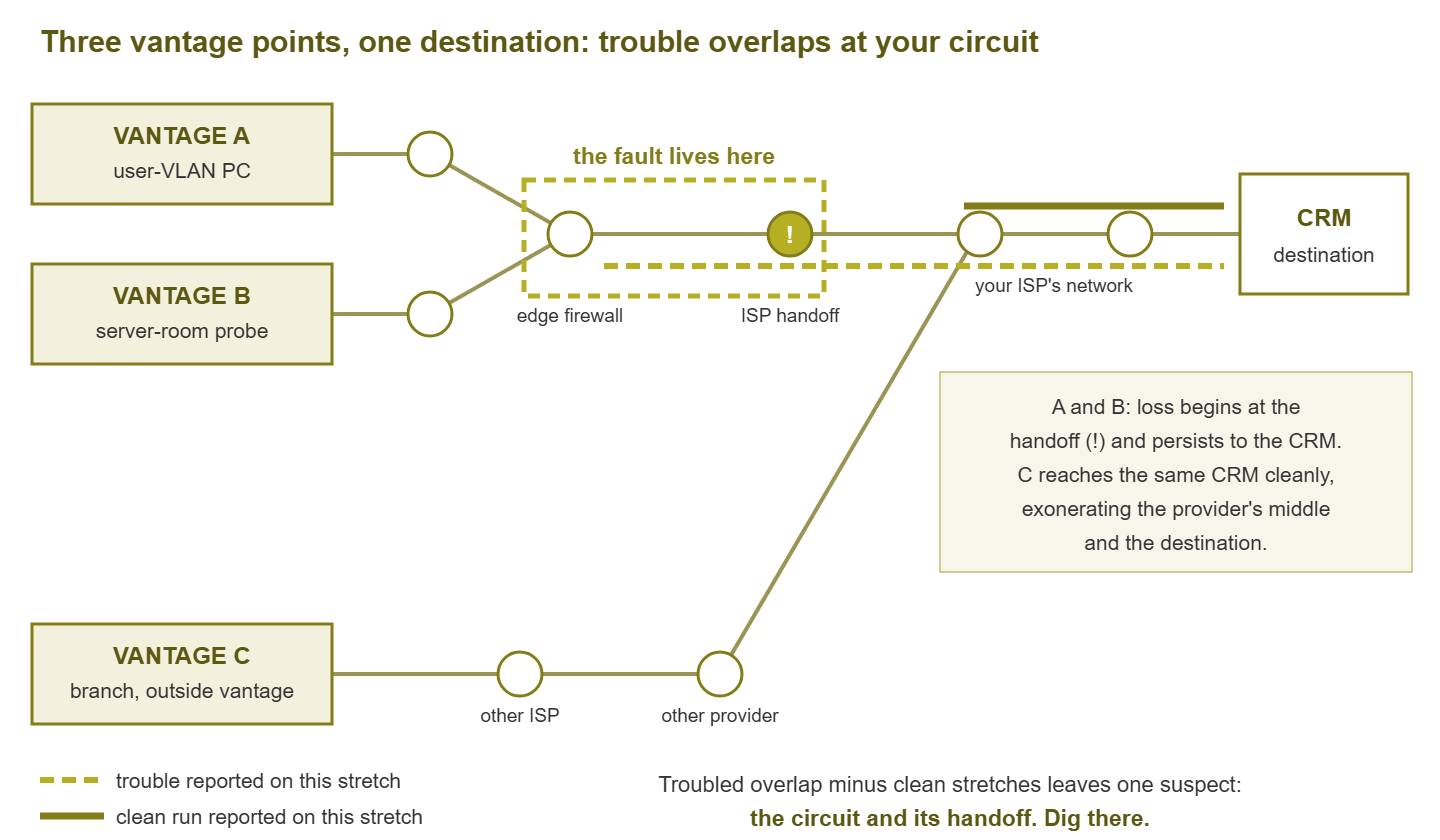
Figure 1: Three vantage points, one destination. The two inside vantages see trouble from the handoff onward; the outside vantage is clean through the provider and the destination. The only segment that is on every troubled road and no clean road is the circuit — so that is where the fault lives.
Every step in the rest of the playbook exists to feed that one sentence. Gather independent roads and mark where each one's trouble begins. Intersect the troubled parts, and subtract everything a clean run has exonerated. What remains is small — usually one device, one link, or one owner.
Choosing your vantage points
A vantage point is just a machine you can test from. You rarely need many; two chosen well beat five chosen lazily. The classic trio covers most incidents:
| Vantage point | Where it sits | The question it answers |
|---|---|---|
| Affected user segment | A PC (or a probe) in the VLAN that raised the ticket | What exactly do users feel, and where does their road go bad? |
| Server segment or monitoring box | Same building, different internal road to the same edge | Is the trouble specific to one segment, or building-wide? |
| Outside vantage | A branch office, a remote probe, any machine that does not use your building's circuit | Is it your building and circuit at all, or the far side? |
The outside vantage is the one nobody has ready when the incident starts. It is worth arranging in peacetime. It could be a small probe at a branch site, or a colleague's machine at another office. Anything you can reach that leaves for the internet through somebody else's front door will do. During an incident it settles the biggest question — us or not us — in one run.
A fourth, quieter vantage trick costs nothing: test toward a second destination from the same sources. If the file-sharing service is slow but a trace to an unrelated, well-known destination rides clean over the same circuit, your edge and circuit just passed a control test. One extra target, one free exoneration.
Running the tests without fooling yourself
With vantage points picked, gather evidence the same way from each. The mechanics are simple; the discipline is what keeps the comparison honest:
- 1. Test the same address everywhere. Use the destination's literal IP address, not its name. Names can resolve differently from different places. Many big services deliberately answer with a nearby server per region. Then your vantage points are tracing different buildings while you think they disagree about one road. If a service genuinely serves each region differently, compare each vantage against its own baseline instead.
- 2. Prefer continuous tests to single shots. One traceroute is one snapshot of a moody system. A few minutes of MTR — or several traceroutes in a row — gives per-hop loss and latency statistics you can actually trust.
- 3. Run them at the same time, during the pain. Simultaneous runs see the same weather. A trace from the office at noon and from the branch at dinnertime are not comparable evidence.
- 4. Save everything, labeled. Vantage name, timestamp, destination — in the filename. Tonight's fix depends on comparing files; next month's provider ticket depends on still having them.
- 5. Add one short trace to your own handoff. From each inside vantage, also test to the first provider address from your register. It draws the "my side / their side" line straight through your evidence.
On Windows machines where you cannot install anything, the built-in pathping is a serviceable stand-in for MTR. It traces, then spends a while measuring per-hop loss, and prints a summary. Slower and chattier, but it turns a user's PC into a usable vantage point with zero installs.
Reading the results: where does trouble begin?
Read each vantage's output alone first, with one rule in mind: a problem is only real if it starts at some hop and persists all the way to the destination. Real congestion or a real fault sits in the road itself, so every packet that crosses it suffers — including the ones going further. In practice you are looking for the first hop where sustained loss or a latency step appears. That trouble must also stay visible on every hop after it, ending at the destination line.
That gives each vantage point a one-line finding: "clean end to end," or "trouble begins at hop N — address so-and-so — and persists." Then intersect the findings. The combinations sort themselves into a handful of stories:
- Only the user vantage sees trouble, starting before the edge: the problem is inside that segment's road — think switching, uplinks, the segment's gateway.
- Both inside vantages see trouble from the handoff onward; outside is clean: your edge device or your circuit. The far side of the internet is fine; your driveway is not.
- Inside vantages see trouble starting deep in the provider's network; outside is clean: likely the provider's middle, on the road your circuit feeds into.
- Every vantage, including the outside one, sees trouble at the destination's last hops: the far end or its provider. Not yours to fix — yours to report and to communicate around.
- No vantage reproduces sustained trouble: the fault is intermittent, directional, or not a path fault. See the final section before burning more hours.
Notice how little interpretation each story needs once the overlap is on the table. The heavy lifting happened when you insisted on multiple vantage points; the reading is almost mechanical.
The hop that only looks broken
Now the trap that has launched a thousand wrong tickets. A router's day job — forwarding packets — runs in specialized hardware and is extremely fast. Answering a traceroute is different. A probe that expires at the router must be handled by its small management CPU. That CPU generates the reply as paperwork, strictly rate-limited and last in line behind real work. Vendors ship routers this way on purpose, so that measurement traffic can never crowd out forwarding.
The result is the classic false positive. Hop five answers slowly or drops half your probes. So it looks like the culprit — while forwarding your actual traffic flawlessly. The tell is downstream. If hop five shows sixty percent loss but hops six through ten and the destination show none, hop five is not losing traffic. In that case, it is ignoring you, which is its right. If hop five's latency spikes but later hops sit at normal levels, same verdict: lazy control plane, healthy road. The mechanics behind this — and the other reading traps, like asterisks and firewalled final hops — are covered in reading traceroute output. The playbook-level rule is simply that no middle hop is guilty unless the trouble carries through to the destination.
Tip: before you name any hop in a ticket or an escalation, make it pass both tests. Its trouble must persist to the destination, and it must appear from at least two vantage points. A hop that fails either test goes back to being scenery.
The verdict: LAN, WAN circuit, or provider
A localization ends with an owner, because the owner determines the next move. There are things you fix, things you pay someone to fix, and things you can only report politely. The handoff points recorded in your register — where your equipment ends and each provider begins — are the property lines that turn a hop address into an owner:
| Where the overlap puts the trouble | Owner | Your next move |
|---|---|---|
| Before your edge device, single segment affected | Your LAN | Switch counters, uplinks, the segment's gateway — the internal game in internal vs. external path analysis |
| At your edge device or the first provider address | Your edge or your circuit | Check the WAN interface's utilization and errors before calling anyone; then the provider, with evidence |
| Several hops into the provider network, both inside vantages agree, outside clean | Provider | Open a ticket with before/after traces and timestamps |
| At the destination's edge, seen from every vantage | The far side | Report to the service or host; tell your users what you know |
One caution on the second row, because it is the most common and the most misread: a saturated uplink imitates a provider problem. When your outbound circuit is full, packets queue and drop at your own edge. In that case, the trace shows latency and loss starting at the first hop past it. That hop happens to carry the provider's address. Before you call anyone, look at the WAN interface's utilization graph and drop counters. It is a five-minute check that saves a very embarrassing ticket.
A worked example, ticket to verdict
Morning ticket: "CRM is crawling for the whole sales floor." Step zero from a sales PC confirms it — loss around four percent, latency double the register's range. The dashboard says other destinations look normal-ish, but the CRM matters most, so on we go. Two inside vantages and one branch-office probe run a few minutes of MTR toward the CRM's address, all at once. Condensed results:
# Vantage A - sales PC          Loss   Avg(ms)
1. 10.20.0.1                     0%      0.4    <- user gateway: clean
2. 10.0.1.2                      0%      0.7    <- edge firewall: clean
3. 198.51.100.1                 22%     61.0    <- ISP handoff: trouble begins
4. 198.51.100.77                21%     63.2
8. 203.0.113.30 (CRM)           20%     66.1    <- persists to destination: REAL

# Vantage B - server-room probe: same story from hop 3 onward

# Vantage C - branch probe       Loss   Avg(ms)
5. 203.0.113.9                   0%     31.8
6. 203.0.113.30 (CRM)            0%     33.5    <- clean end to end
Read it with the playbook. Both inside vantages agree: clean through the building, trouble beginning at the handoff and persisting to the destination — real, not control-plane theater. The branch reaches the same destination cleanly through the same provider's core, which exonerates the provider's middle and the far end. The overlap leaves one suspect: the office circuit and its handoff.
Second row of the verdict table says: edge counters before phone calls. And indeed — the firewall's WAN interface shows outbound utilization pinned at line rate since mid-morning, output drops climbing. The culprit turns out to be a server replicating offsite in the middle of the day. The "slow CRM" was collateral damage from a full uplink. Traffic shaped, replication rescheduled, latency back in range within minutes. Had those counters been clean, the very same evidence was the finished escalation package for the provider. That evidence was two inside vantages, a clean outside run, and trouble pinned at the handoff. Either way, the playbook ends the argument.
When the evidence will not converge
Sometimes the story refuses to be tidy. The three honest reasons, and what to do about each:
- The problem is intermittent. Snapshots keep missing it. Stop snapshotting: leave continuous tests running from two vantage points and let long-term latency graphing catch the window, then localize inside it.
- The road itself changed. If today's path no longer matches the register, you are debugging a detour, not a fault — and detecting path changes is the guide for that.
- The trouble is one-way. Everything you traced looks fine because the fault rides the invisible return road. Traceroute only ever shows the outbound half — asymmetric routing explains the other half and how to test it.
And that is the whole craft, compressed. Prove the symptom and gather independent roads. Intersect the trouble and subtract the exonerated. Check your own counters before blaming anyone, and hand the verdict to the owner with evidence attached. Do it twice and it becomes reflex. The rest of the Path & Hop-by-Hop Analysis guides supply the baselines, change detection, and asymmetry know-how that make each step sharper.
Put this into practice with SysPeep Monitor
The hardest part of localization is having vantage points and baselines ready before the ticket arrives. SysPeep Monitor's remote probes act as standing vantage points at every site. They watch latency, loss, and interface counters around the clock. So when something breaks, the before-and-after evidence is already collected. The free trial installs on a Windows machine in minutes.
Download Free TrialLearn About SysPeep - All Rights Reserved.