
Building a Live Status Map That Tells the Truth
A status map is the picture most people mean when they say "the monitoring." It is the one on the wall, the one the manager glances at on the way to a meeting. And it is the one that gets a screenshot pasted into the incident report. It is also the picture most likely to be wrong in a way nobody notices. That is because a map that is green looks exactly the same whether the network is healthy or the map has stopped listening.
I have built status maps that lied in three different ways. One painted forty devices red because a single uplink failed. One showed a whole site green for a day after the probe that watched it died. One was accurate and unreadable. That was because I had put every device in the company on a single canvas and the boxes were the size of rice. This guide is what I do differently now.
By the end you will be able to choose the scope of a map. You will be able to lay it out so a stranger can read it, and colour it with four states instead of two. You will be able to wire the colours to the monitoring system's dependency settings so one failure shows as one failure. And you will be able to mark stale data so silence is never mistaken for health. There is a build checklist you can copy, a worked example with a drawing, and a short story about the green site.
In this guide
- What a status map is
- Choosing the layer and the scope
- Layout rules
- Status colours and the fourth colour
- Dependency-aware colouring
- Marking stale data
- On the map, on hover, on click
- The map build checklist
- A worked example: Northgate Retail
- A war story: the green site
- The status map checklist
- Where to go next
What a status map is
A status map is a picture of devices and the links between them, where each device and link is coloured by its current state. The state comes from the monitoring system's last poll. That is one round of asking every device "are you there, and how are you?", typically every one to five minutes. The map repaints after each poll. That is the whole mechanism.
A status map answers one question: "what is down right now, and where?" It does not answer "how busy is it?" (that is a weathermap) or "which of these hundred things is unusual?" (that is a heatmap). If you have not yet decided which picture your question needs, choosing the right picture comes first.
A status map is also not a documentation diagram. The drawing you keep with cable labels and patch-panel numbers is a different object, covered in network diagrams. And many monitoring tools will draw a first topology for you from discovered data, which auto-generated maps weighs up. An auto-drawn map is a good starting layout and a bad finished one.
Choosing the layer and the scope
One map per site or per layer, never everything on one page. A network has layers. The core contains the central switches everything funnels through. The distribution layer contains the switches that aggregate floors or buildings. The access layer contains the switches users and printers plug into. The WAN is the wide area network: the links between sites, usually rented from a carrier. A map that shows all four layers for all sites shows a few hundred boxes. And a few hundred boxes is a crowd, not a picture.
The pattern that works is a small hierarchy of maps. At the top, one overview map with one box per site, each box coloured by the worst state of anything inside it. Below that, one map per site showing that site's distribution and access layers. Alongside, one map for the core and WAN, showing the links between sites and the data centre. Three levels, each answering its own question, each small enough to read.
The test for scope is whether every box on the map is one the reader would act on. The on-call engineer needs sites. The engineer walking to a comms room needs the switches in that comms room. Nobody needs a map with both, and everybody gets offered one. (The offer usually comes with the phrase "while you're in there.")
Layout rules
Lay the map out in the direction traffic flows. Top-down works for most networks: the internet or the data centre at the top, core below it, distribution below that, access at the bottom. Left-to-right works just as well if the screen is wide. A layout that follows where the boxes landed when the tool discovered them does not work. That is because the reader has to learn the map before they can read it.
Draw sites as boxes and links as lines. A site box is a rectangle with a name in its corner and the site's devices inside it. The box tells the reader "these things are in the same building" without a single label. Links are lines between devices; a link between sites leaves one box and enters another.
Avoid crossings where you can. Two lines that cross make the reader stop and work out which goes where. On a map that is read in a hurry, every stop is a cost. Route WAN links around the outside of the site boxes rather than through them.
Status colours and the fourth colour
A status map needs four colours, and the fourth is the one that makes it truthful. The first three are the ones every tool ships with. They are green for up, amber for warning (up, but a threshold has been crossed), and red for down. The fourth is grey, for unknown. The monitoring system has no current evidence about this device, either because it has not been polled or because the thing that polls it has stopped.
Down and unknown are different facts and must look different. Down means "we asked, and it did not answer." Unknown means "we did not ask, or nobody was listening for the answer." A device behind a dead uplink is unknown, not down. It may be perfectly healthy and simply unreachable from where the monitoring system sits. A device whose collector has crashed is unknown, not up, and a map that keeps it green is reporting a memory as a fact.
The grey must be visibly different from the green, and I mean from across the room. A pale grey next to a pale green is the same colour at three metres. Give unknown a distinct treatment: a dashed outline, a white fill, a small "?" badge, or all three. A reader who sees grey should know at once that the map is making no claim about this device.
Tip: put the four colours in a legend on the map itself, in a corner. Write the meaning of grey in words: "unknown — no current data." The other three explain themselves. Grey never does, and it is the one that matters at two in the morning.
Dependency-aware colouring
A dead uplink should paint one box red, not forty. When the router at a branch fails, every device behind it stops answering polls, and a naive map colours all of them red. The truth is that one device has failed and the rest are unreachable, which is a different fact with a different fix.
The mechanism is the parent-child dependency. In the monitoring system, each device is given a parent: the device that has to be up for this one to be reachable. The branch switch's parent is the branch router. The branch router's parent is the WAN link, or the core switch at the far end. When a parent is down, the monitoring system marks its children as unreachable (or "unknown," depending on the product) instead of down. It suppresses their alerts, so you get one notification about the router and not forty about the things behind it. Dependency thinking is the guide for working out who depends on whom. And dependency suppression covers the alerting side.
The map should read the same dependency settings. When the tool knows a child is unreachable because of its parent, the map colours the child grey with a dashed outline, not red. In that case, the map colours the parent red. The reader's eye goes to the one red box, which is the one to fix. Most monitoring tools that support dependencies will colour their built-in maps this way automatically. If you are drawing the map in a separate tool from exported state, you have to apply the rule yourself. The logic is small enough to write down:
# Illustrative: the state a map should paint for a node.
# parent_of[node] is the node's dependency parent, or None.
# raw_state[node] is what the last poll said: "up", "warning", "down".
def painted_state(node):
    parent = parent_of.get(node)
    if parent and painted_state(parent) in ("down", "unknown"):
        return "unknown"          # unreachable because of a parent, not down
    if last_poll_age(node) > 3 * poll_interval:
        return "unknown"          # stale: nobody has heard from it
    return raw_state[node]        # up, warning, or genuinely down
Two details keep this honest. First, the collector is a parent too. Devices polled by a remote probe depend on that probe, so if the probe dies they go grey, not green. The guide probes and collectors explains the roles. Second, a wrong dependency lies in both directions. Point a child at the wrong parent and a real outage hides behind a grey box. The dependency chain is part of the map and needs the same review.
Marking stale data
Every node on the map needs a last-updated time, and the map needs a rule for what to do when that time gets old. Stale data is a state that was true at the last successful poll and has not been refreshed since. A node that was green ten minutes ago and has not been polled since is not green now. It is unknown, and the map should say so.
The rule I use is grey after three missed polls. With a five-minute poll, that means a node turns grey if nothing has been heard for fifteen minutes. Three is a compromise: one missed poll is common and would make the map flicker. Ten would leave a dead collector invisible for most of an hour. Adjust to your poll interval, and write the number on the legend.
The map itself needs a timestamp too, large enough to read from wherever the map is read. A map whose nodes are all fresh but whose page stopped refreshing an hour ago is a screenshot. And a screenshot is the most convincing lie a monitoring system can tell. Put the time of the last repaint in a corner, and if the page is more than two poll intervals old, grey the whole thing.
On the map, on hover, on click
The map shows state; everything else waits behind a hover or a click. A box on the map carries a name and a colour, and possibly one small badge (an active alert count, or a "?" for unknown). Every extra label drawn onto the map makes the boxes bigger, the map denser, and the one red box harder to find.
Hover is for the second question. When the reader has found the red box, the next thing they want is "since when, and what exactly?" A hover panel shows the device's IP address, its last poll time, how long it has been in this state, and the alerts currently open against it. A click is for the third question, "what does its history look like?" And the click should open the device's own page in the monitoring console, with graphs.
This split is what lets one map nearly work on a wall and in a browser. On the wall nobody can hover, so the map must be readable from state alone. In the browser the hover carries the detail. If you find yourself adding text to the map so the wall can see it, you have found a question the wall does not need to answer. The NOC wall guide covers what belongs there.
The map build checklist
This is the list I work through for every new map. Copy it, and tick every line before the map goes anywhere near a wall.
- The question the map answers is written in one sentence at the top of the map's page.
- The scope is one site, or one layer, or the site overview; not more than one.
- Layout runs in the direction of traffic (top-down or left-to-right), with sites as boxes and links as lines.
- Link lines do not cross where a re-route would avoid it; WAN links run outside the site boxes.
- Four states are defined: up, warning, down, unknown. Unknown is grey with a dashed outline.
- Every device on the map has a dependency parent set in the monitoring system, including its collector.
- A child of a down parent is painted unknown, not down.
- Every node stores a last-poll time; a node goes grey after three missed polls.
- The map shows a last-repaint timestamp large enough to read from where the map is read.
- The legend is on the map, and the meaning of grey is written in words, with the stale threshold in minutes.
- Only name, colour, and one badge are drawn on each box; detail is on hover, history is on click.
- The device list on the map has been compared with the monitoring system's device list; no device in scope is missing.
- The map has an owner's name and a review date on it.
A worked example: Northgate Retail
Northgate Retail has a head office, two branches, and a small data centre at a hosting provider. The core lives in the data centre: two switches, core-a and core-b, linked to each other. The head office has one distribution switch, dist-1, with links to both cores. The head office also has three access switches, acc-1 to acc-3, hanging off the distribution switch. Each branch has a router and a switch. And each router has a WAN link to one of the cores: north to core-a, south to core-b.
The map is laid out top-down. The data centre box sits at the top with the two cores side by side. The head office box sits below it with dist-1 on top and the three access switches in a row beneath. The two branch boxes sit at the bottom, one left and one right. And their WAN links run up the outside edges of the map to the cores, so nothing crosses the head office box. In text, it looks like this:
              [ DATA CENTRE ]
           core-a -------- core-b
             |  \        /   |
             |   \      /    |
             |  [ HEAD OFFICE ]
             |      dist-1   |
             |    /   |   \  |
             | acc-1 acc-2 acc-3
             |               |
  [ BRANCH NORTH ]     [ BRANCH SOUTH ]
  rtr-north - sw-north   rtr-south - sw-south
Dependencies follow the lines. Each access switch has dist-1 as its parent. dist-1 has two parents, which most tools handle by treating the child as reachable while either parent is up. Each branch switch has its branch router as its parent. And each branch router has the core at the far end of its WAN link as its parent. The remote probe at each branch, if there is one, is the parent of everything it polls.
Now the north WAN link fails. rtr-north stops answering and goes red. sw-north also stops answering, but its parent is down, so the map paints it grey with a dashed outline and the label "unknown (dependency)." The link line between them goes dashed. Everything else stays green, except the link from core-a to dist-1, which happens to be busy this morning and shows as a thick amber line. The reader sees one red box, one grey box beside it, and one busy link. The reader knows in a second that the north branch has lost its WAN and that the switch behind it is probably fine.
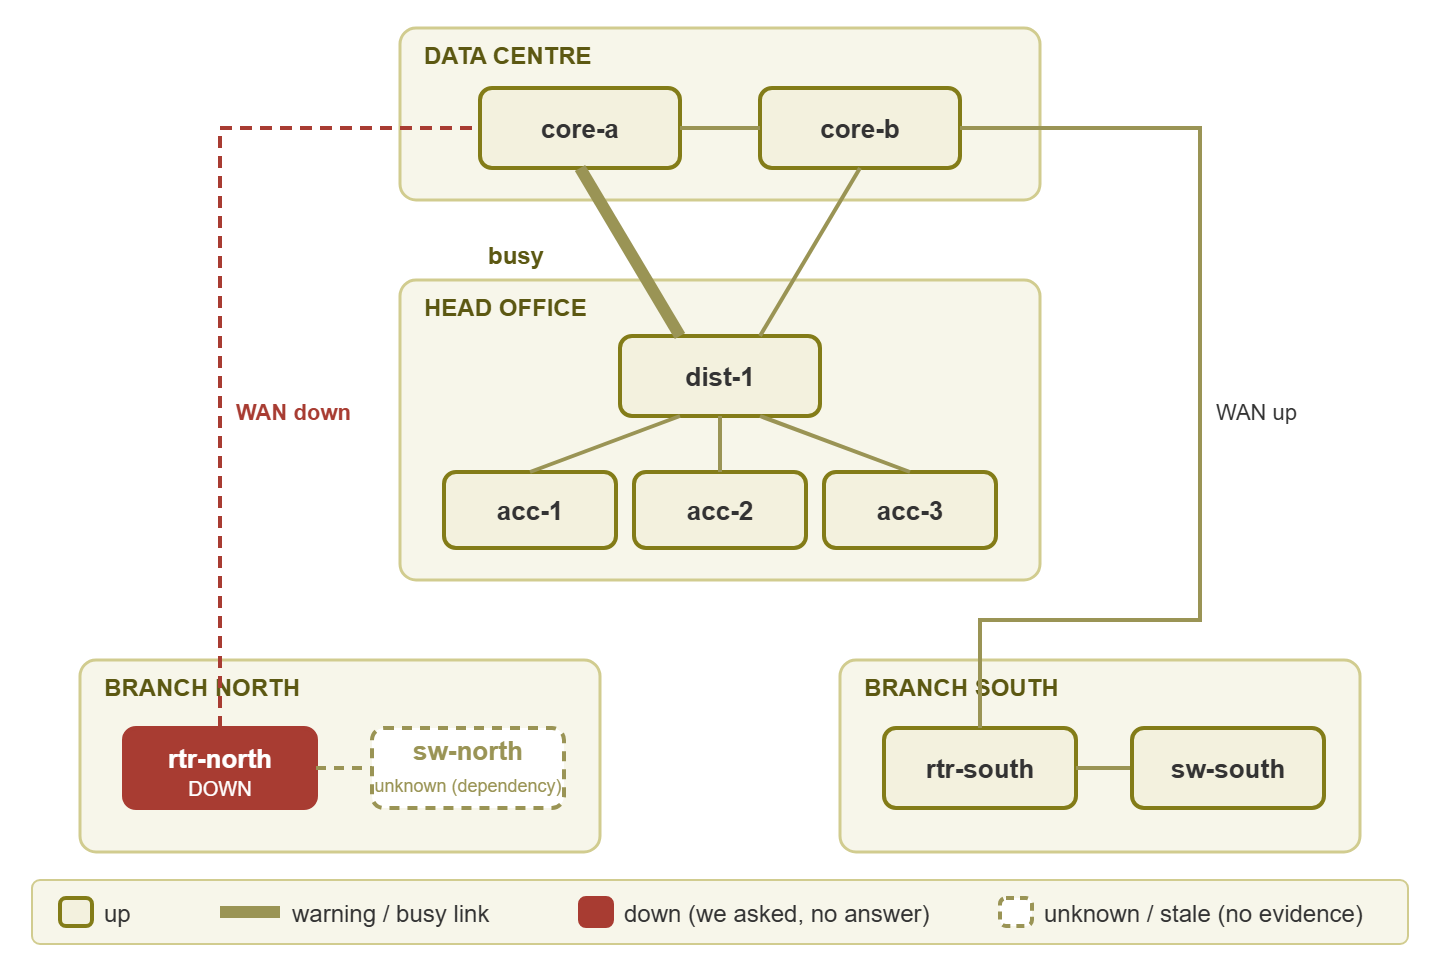
Figure 1: Northgate Retail's status map after the north WAN link fails. One red box, one grey dependency box, one busy link. The legend spells out that grey means no evidence, not health.
Compare that with the naive version. Without dependencies, sw-north is red too, along with every access point at the north branch. In that case, the on-call engineer gets a page for each. With dependencies but without the fourth colour, sw-north stays green because its last poll said up. Then the map claims a switch is healthy when nobody has heard from it.
A war story: the green site
Bellweather Logistics ran a remote probe at its main warehouse to poll the forty devices there. The probe's disk filled up on a Friday evening. The probe stopped polling. The central server kept the last state it had received. And the warehouse stayed a reassuring green on the wall map all weekend. On Saturday afternoon the warehouse's core switch lost power. Nobody in the office learned about it until a driver rang to ask why the loading-bay screens were blank. The incident review noted that the map had been "accurate as of Friday," which was true. The review also noted that the map had not said so, which was the problem. The fix was a dependency from every warehouse device to the probe, a grey rule at three missed polls, and a heartbeat check on the probe itself.
The story is ordinary, which is why I tell it. A disk filled, as disks do, and a map did what maps do when nobody has told them the difference between "last known" and "known." Keeping that difference visible is the subject of keeping maps truthful. The check that would have caught the probe on Friday night is in heartbeats and dead-man switches.
The status map checklist
The build checklist is for making a map. This shorter list is for judging one you inherited.
- Can a new starter say what is down and where, without a legend, in five seconds?
- Is there a grey state, and does it look different from green from across the room?
- When a router fails, does the map show one red box or a red site?
- Does every device on the map have a parent, including its collector or probe?
- Is there a timestamp on the map, and a stale threshold in the legend?
- Is there a name and a review date on the map?
Where to go next
A truthful status map is four colours, a dependency chain, and a clock. The four colours let it say "I do not know" out loud. The dependency chain lets one failure look like one failure. The clock lets the reader tell a live picture from a screenshot. Everything else is layout, and layout is easy once the map is small enough to read.
The next picture in this pillar puts link load onto the same topology: weathermaps. After that, heatmaps answer the question a map cannot. All of them live under Visualizing Network Health: Maps, Weathermaps, and Heatmaps.
Put this into practice with SysPeep Monitor
The dependency colouring in this guide only works if the monitoring system knows who depends on whom. SysPeep Monitor auto-discovers devices and interfaces. It lets you set dependencies so a parent failure does not flood the map with red. It draws its network maps and live dashboards from the same web console. It has optional remote probes for branch sites. The free trial installs on a single Windows machine.
Download Free TrialLearn About SysPeep - All Rights Reserved.